Normal view

There are new articles available, click to refresh the page.
Yesterday — 25 July 2026Vehicles

8 Out Of 10 Americans Would Rather Take A Gas SUV Off-Road Than An EV

  • Plenty of Americans yearn for adventure, but not in an electric SUV or pickup.
  • Hankook’s new study says 64% of Americans want to go off-roading this summer.
  • The study shows local pickup drivers would take an ICE over an electric off-roader.

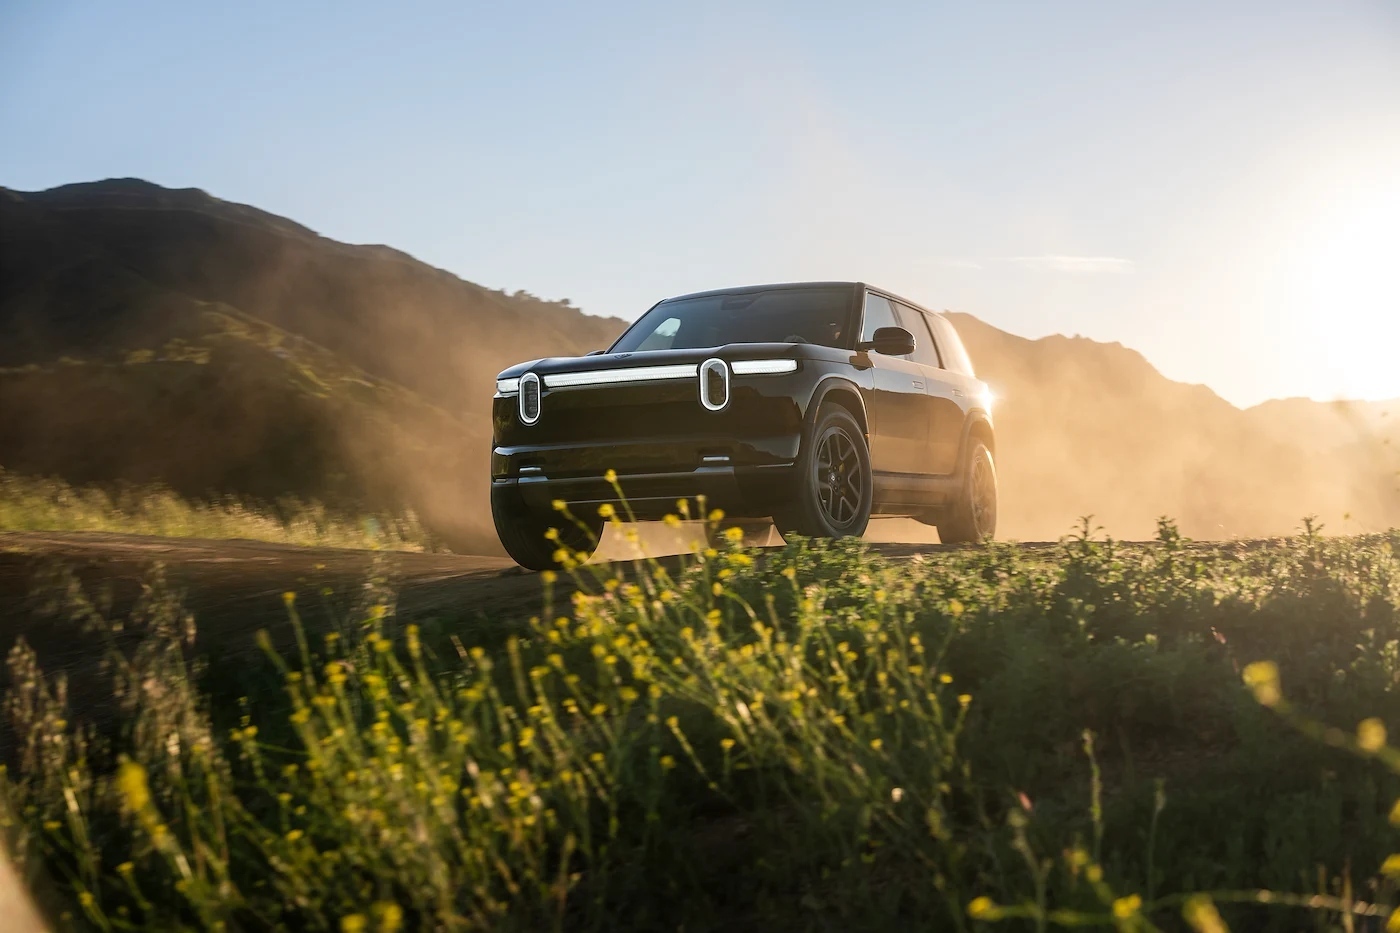
A new study has revealed that Americans are feeling adventurous this summer, eager to get away from civilization and enjoy some off-roading. Of those surveyed, the overwhelming majority would take a combustion-powered vehicle over an EV.

Read: Jeep’s Next EV Could Be Made In China Instead Of Ohio After Stellantis Deal

Hankook Tire’s latest Gauge Index survey found that 64 percent of respondents are interested in taking an all-terrain or off-road driving adventure this year. That’s a huge jump from the 34 percent who expressed interest in doing the same last year.
 8 Out Of 10 Americans Would Rather Take A Gas SUV Off-Road Than An EV

But, as is often the case with studies like these, there’s more than meets the eye. Last year’s survey asked a different question. The 34 percent figure didn’t measure people planning an off-road adventure at all; it counted respondents who named “off-roading proficiency” as the top recreational driving skill they wanted to learn.

74 percent of Gen Z and 72 percent of Millennials want to take an off-road trip this year. However, it’s not just younger folk who want to make the most out of summer, as 57 percent of Gen X drivers and 42 percent of Baby Boomers want to do the same.

ICEs Rule Over EVs
 8 Out Of 10 Americans Would Rather Take A Gas SUV Off-Road Than An EV

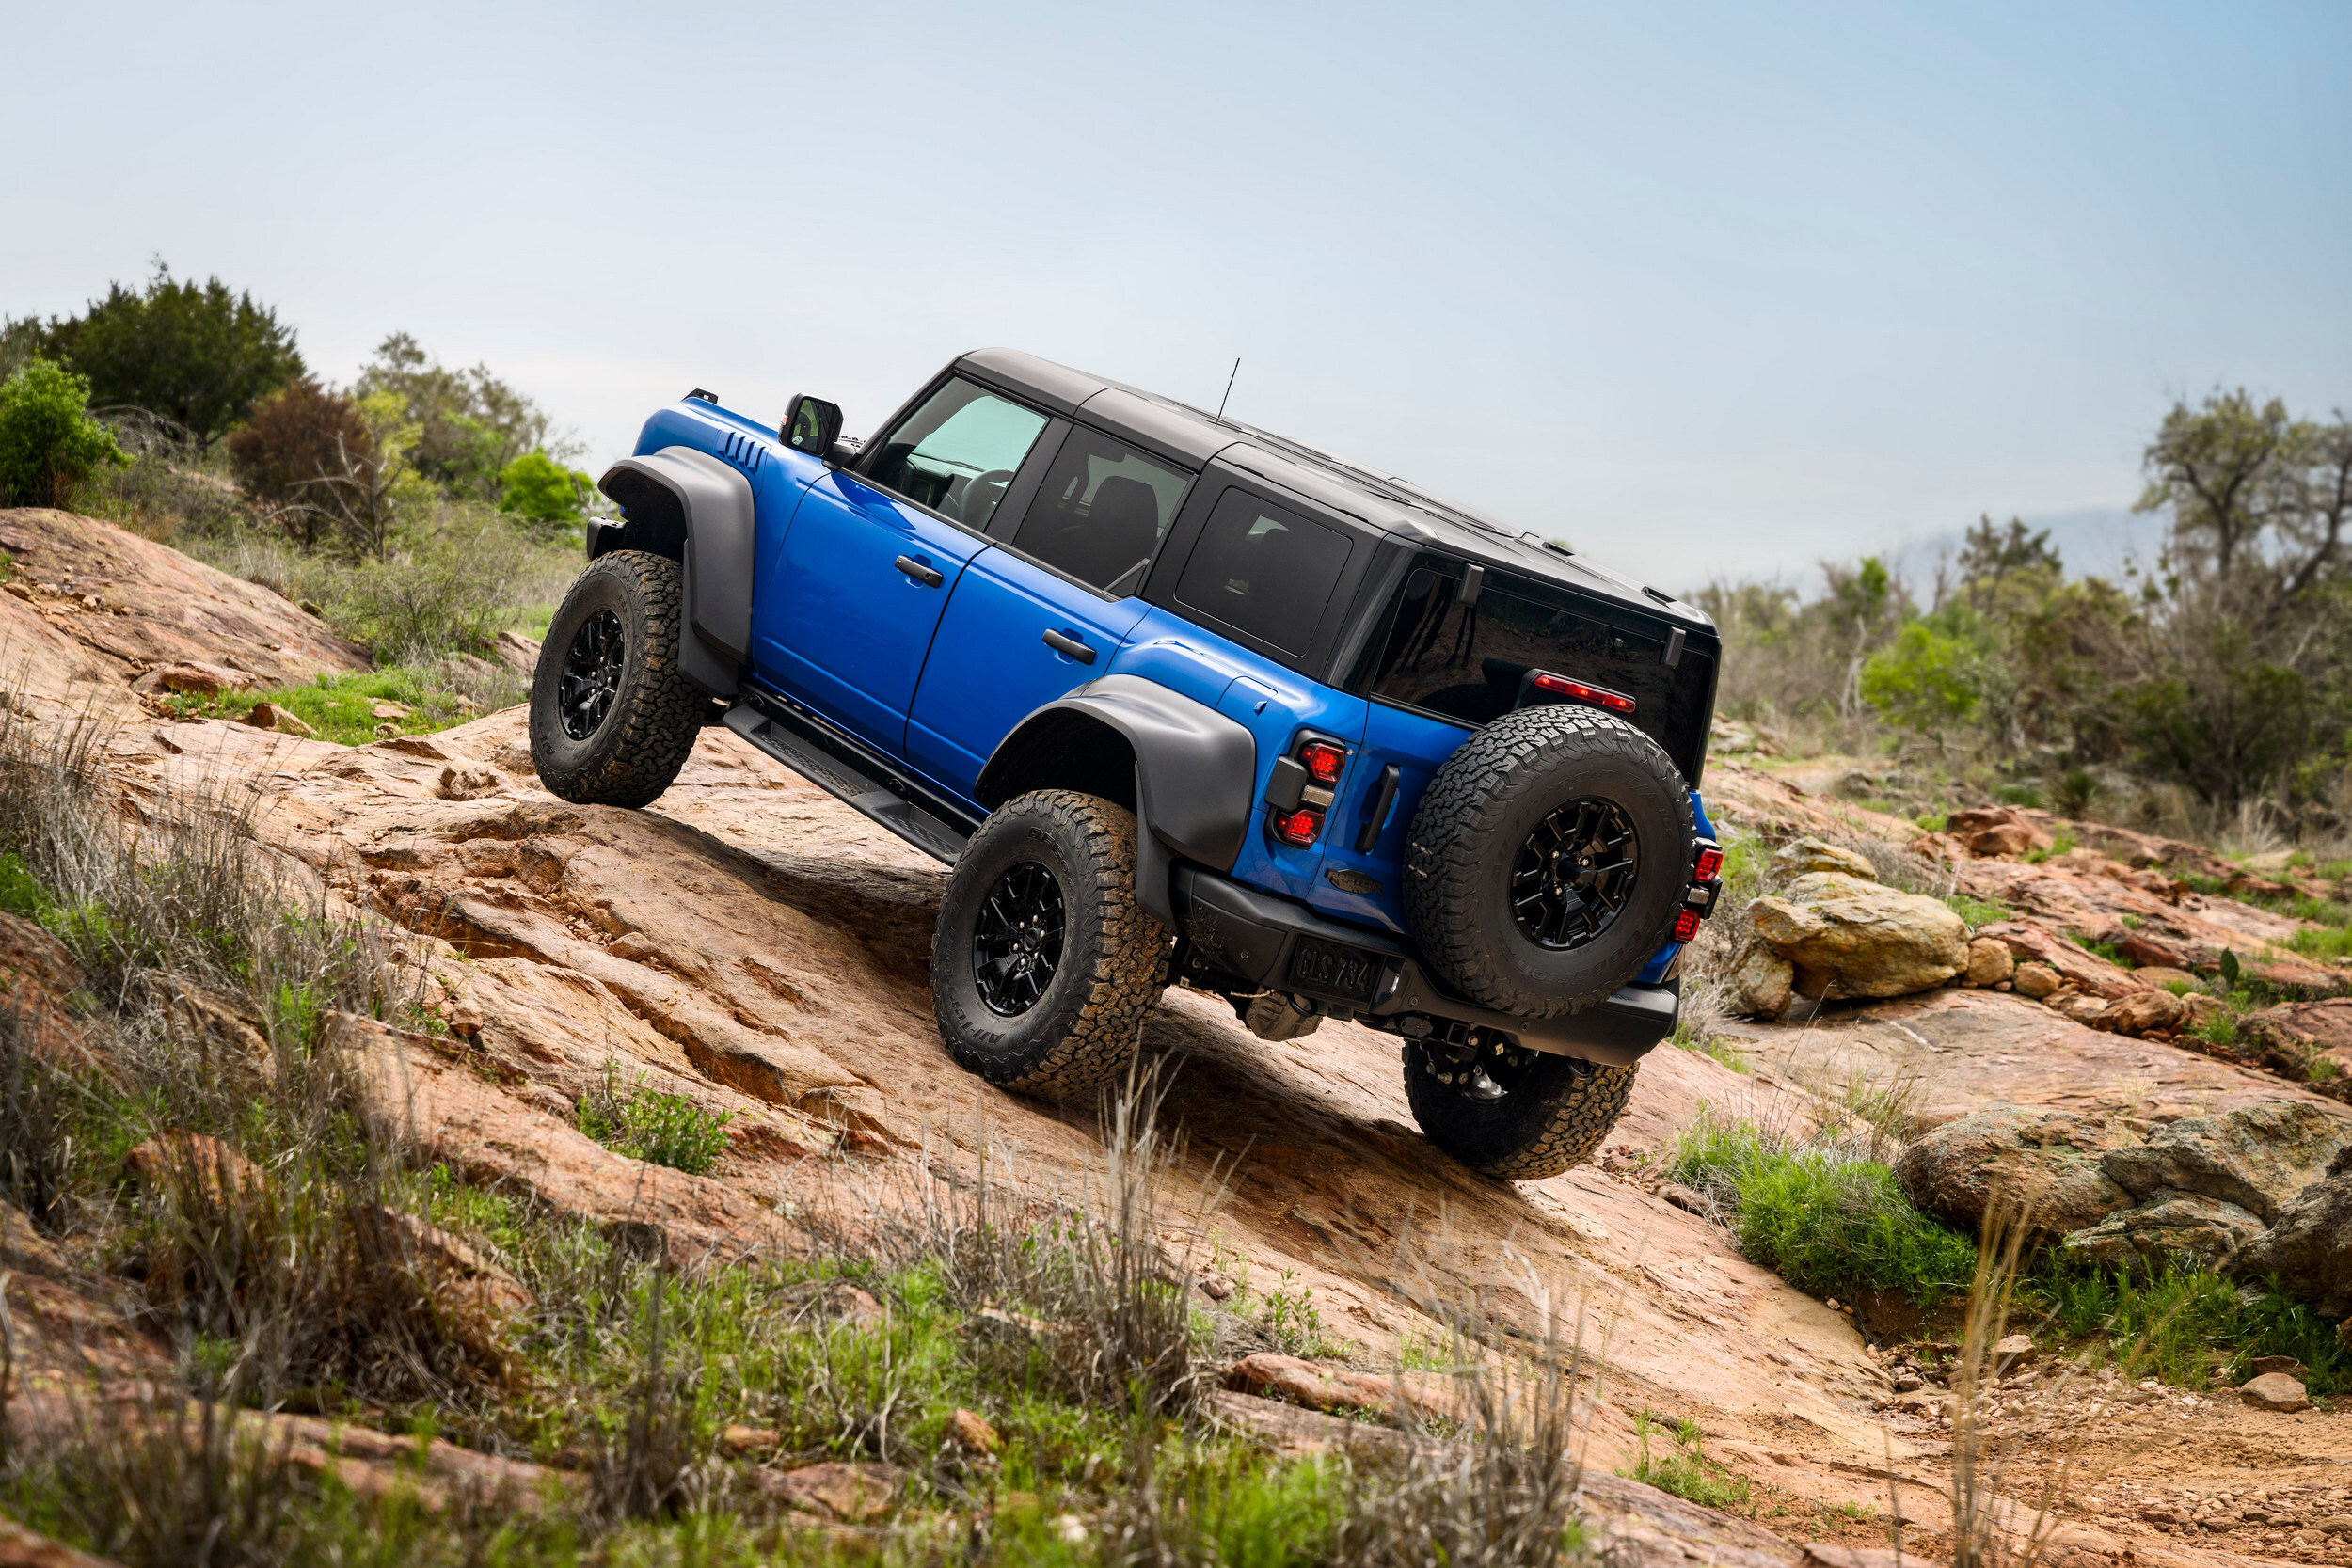
The study also sheds light on what types of vehicles motorists think are best for these trips. 52 percent believe an SUV is best, while 36 percent would go with a pickup truck. Unsurprisingly, most people still favor combustion engines over EVs, with 79 percent preferring a gas-powered SUV over an electric one, while 87 percent of pickup drivers would take an ICE model over an EV.

It appears most of those interested in an off-road experience want something tame, rather than climbing over rocks at Moab. As such, 45 percent said they plan to take a trip along wooded trails while just 17 percent would prefer exploring a desert.

Of course, it’s worth noting that this study, just like so many others you read about, only polled a small group of people. In fact, Hankook quizzed just 1,000 randomly selected American drivers aged 18 and older. So, if you’re someone who has no interest in off-roading, you can rest easy knowing millions of others feel the same.
 8 Out Of 10 Americans Would Rather Take A Gas SUV Off-Road Than An EV
Before yesterdayVehicles

The Priciest Repair On A Used EV Isn’t The Battery

  • Smaller electrical faults top repair requests for EVs in new Warrantywise study.
  • On-board chargers proved priciest common repair, some fixes costing thousands.
  • Main underfloor high-voltage batteries don’t figure in the list of top five EV faults.

If you’re shopping for a used EV, chances are the health and longevity of the high-voltage battery, the big slab of cells under the floor, is the thing keeping you awake at night. But according to a new analysis of warranty repair requests, it’s far from the problem owners encounter most often.

The study, based on repair request data collected by Warrantywise in the UK, found that the biggest EV reliability headaches are largely the same kinds of issues drivers have dealt with for years on cars running more conventional combustion powertrains. Electrical gremlins, suspension wear, and even the humble 12-volt battery appear far more frequently than failures involving the high-voltage battery pack.

 The Priciest Repair On A Used EV Isn’t The Battery

Leading the list were general electrical faults, including sensors and central locking systems. Those repairs averaged around £810-900 ($1,085-1,205), although some individual claims climbed well beyond £3,000 ($4,020) and even topped £4,000 ($5,350) depending on the fault.

Also: An American EV Was Germany’s Most Defective Vehicle

Suspension components, particularly wishbones, also featured prominently. Average repair requests exceeded £1,200 ($1,600), with the largest individual claim passing £4,100 ($5,490). That’s a reminder that even without an engine or gearbox, an EV still has plenty of conventional hardware that wears over time – and with more weight to bear, suspension takes an even bigger beating in an EV.

Top 5 EV Faults
Failure AreaFailure PartAvg Repair
Cost
Most Expensive
Repair Cost
1Electrical systemSensors£810 ($1,085)£3,270 ($4,380)
2Electrical systemCentral locking mechanism£900 ($1,205)£4,060 ($5,435)
3EVOn-board charger£2,160 ($2,890)£10,455 ($14,000)
4SuspensionWishbones£1,230 ($1,650)£4,120 ($5,515)
5Electrical systemAuxiliary battery (12V battery)£535 ($716)£990 ($1,325)
SWIPE

The only genuinely EV specific component to crack the top five was the on-board charger. While the average repair request for one of those came in at £2,160 ($2,890), the largest single claim reached a hefty £10,455 ($14,000), showing that although these failures aren’t everyday occurrences, they can become scarily expensive.

Battery Problems Overblown

What about the high-voltage traction battery everyone worries about? It didn’t make the top five at all. That doesn’t mean battery failures never happen, only that they were comparatively rare in the warranty data, quite possibly because EV batteries are more robust than many people think, and they tend to have longer factory warranty cover than the rest of the car. When problems did occur, though, repair requests averaged more than £6,400 ($8,570).

 The Priciest Repair On A Used EV Isn’t The Battery
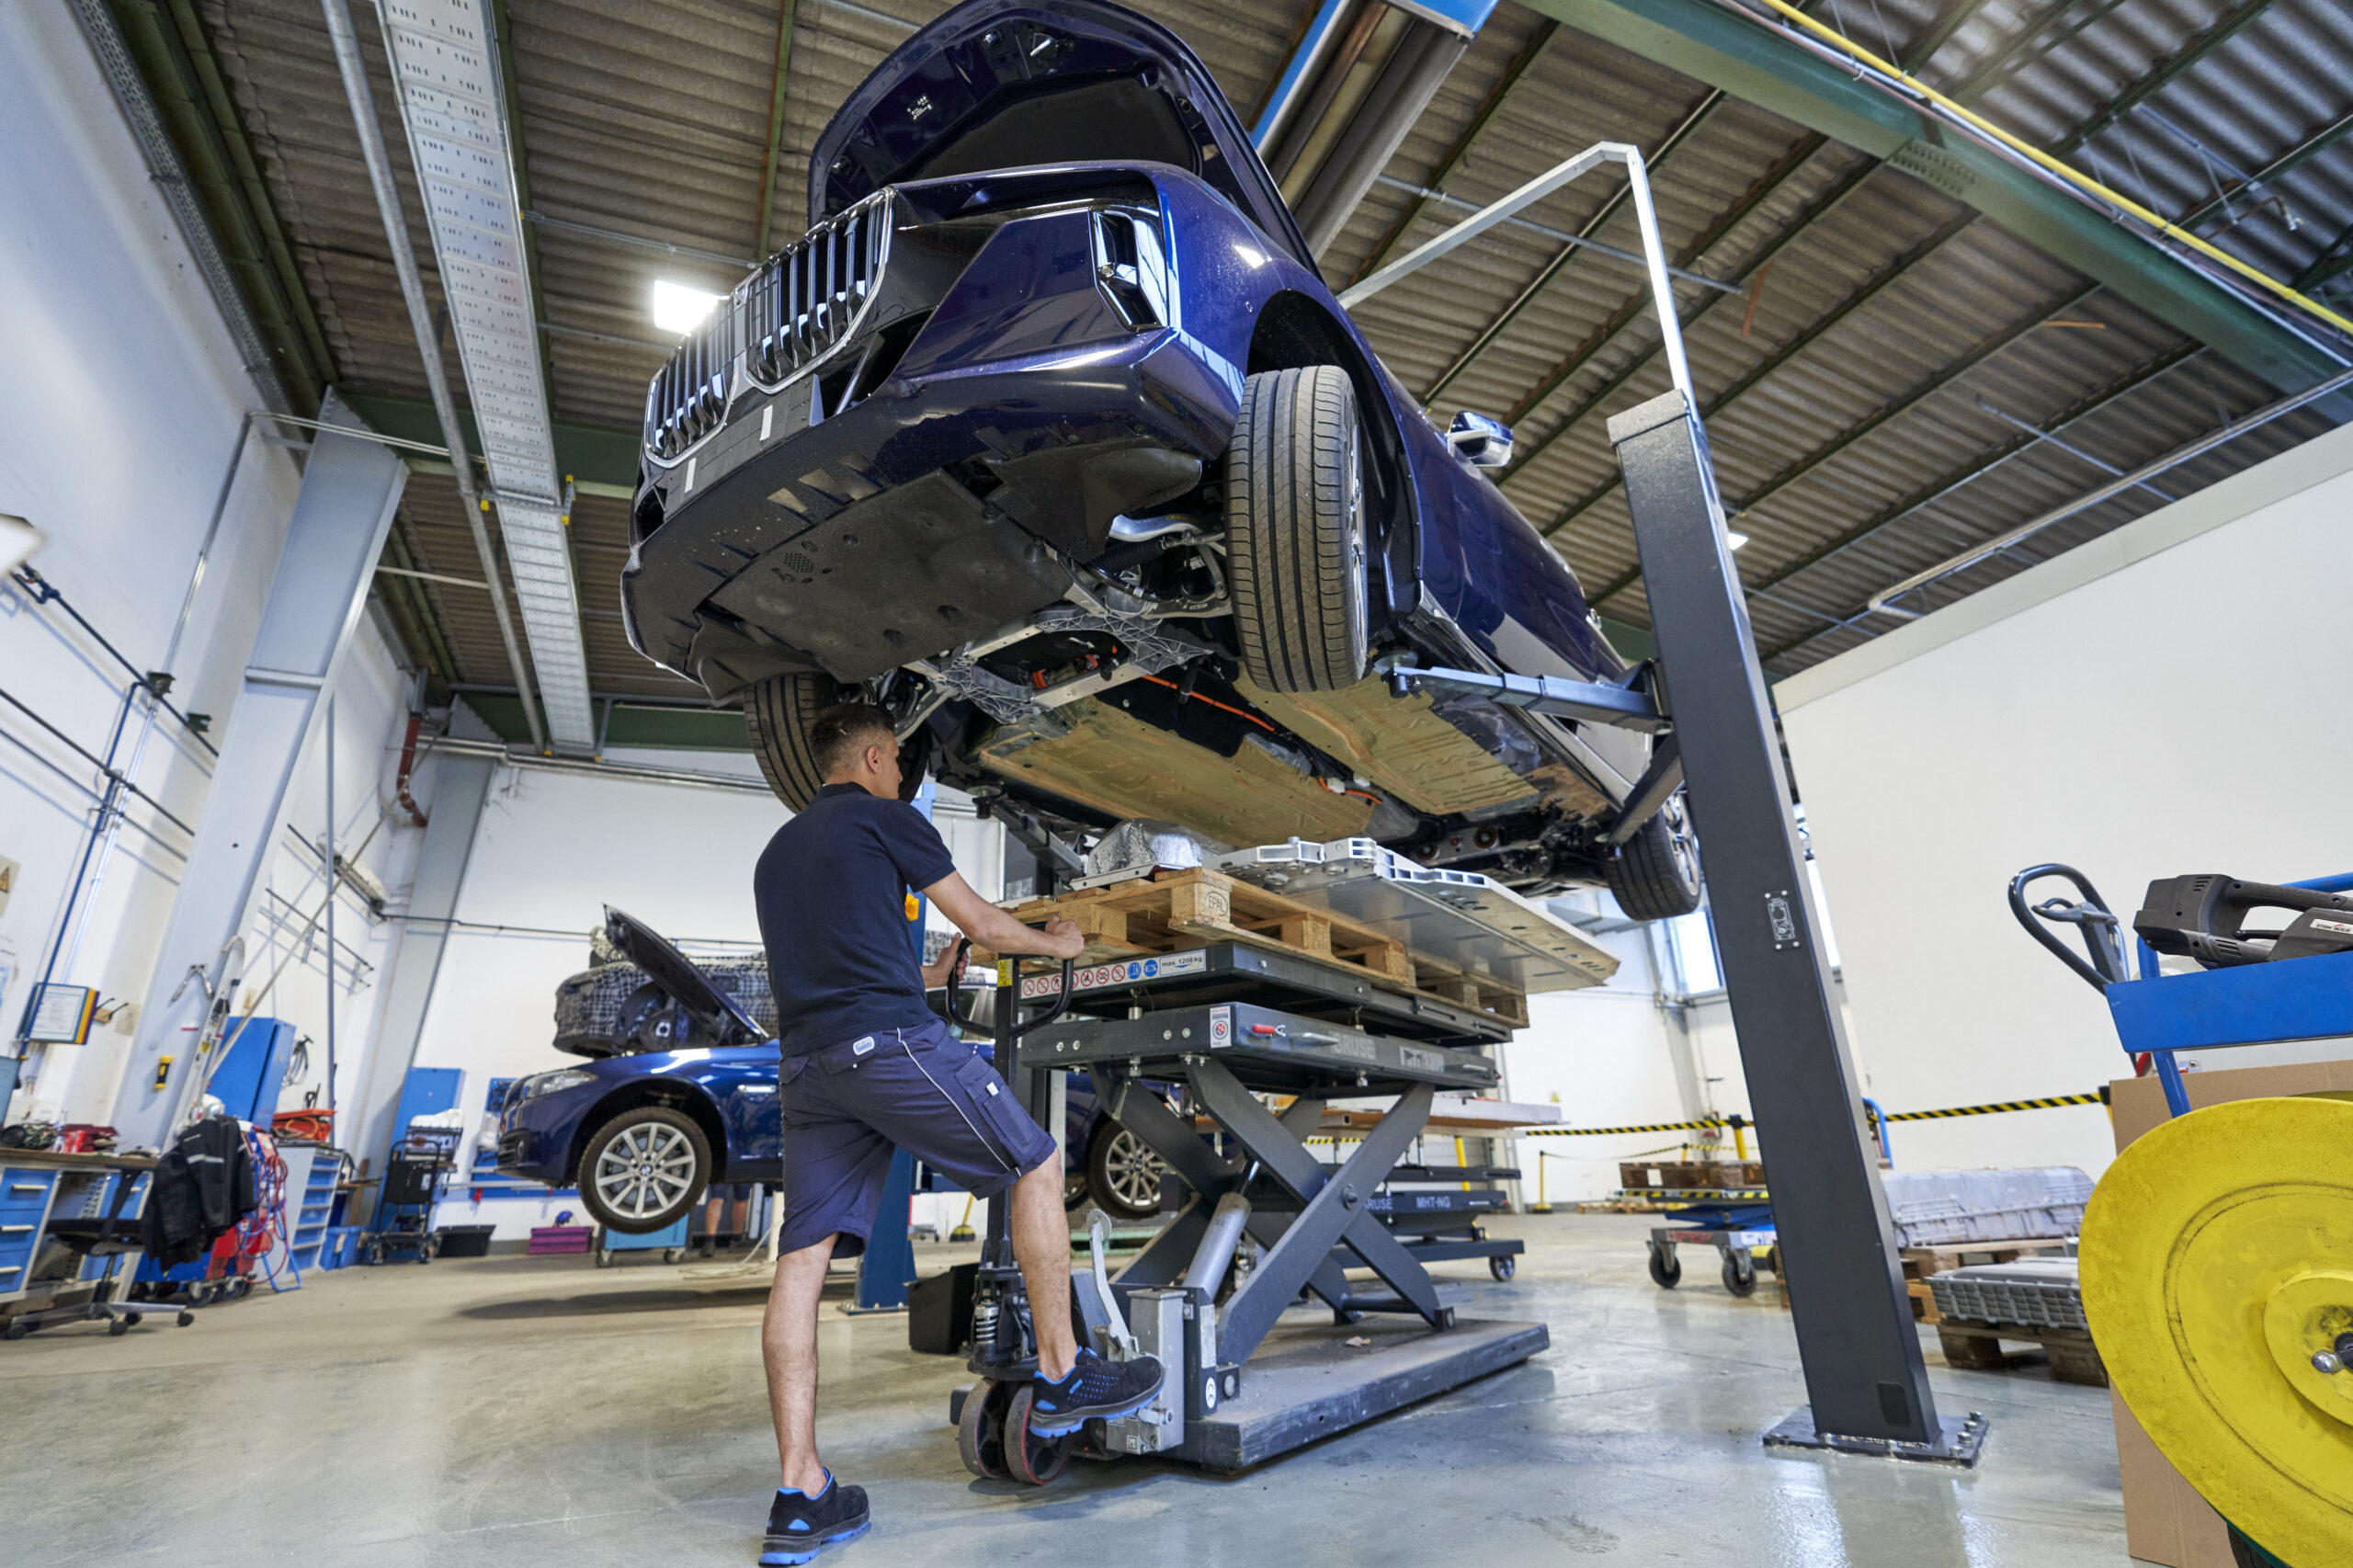
BMW

The figures also showed average EV repair request values increased by 10.7 percent between 2024 and 2025. That rise isn’t necessarily down to worsening reliability, with inflation, labour costs, and parts prices all likely contributing to higher bills.

Also: Huge Study Shows EVs More Reliable Than ICE Cars With One Surprising Common Issue

As with any warranty dataset, the results only reflect vehicles covered under those policies rather than every EV on the road. Even so, it points to the expensive battery that dominates so many buying conversations as not being the scary bill-in-waiting it’s made out to be.

 The Priciest Repair On A Used EV Isn’t The Battery
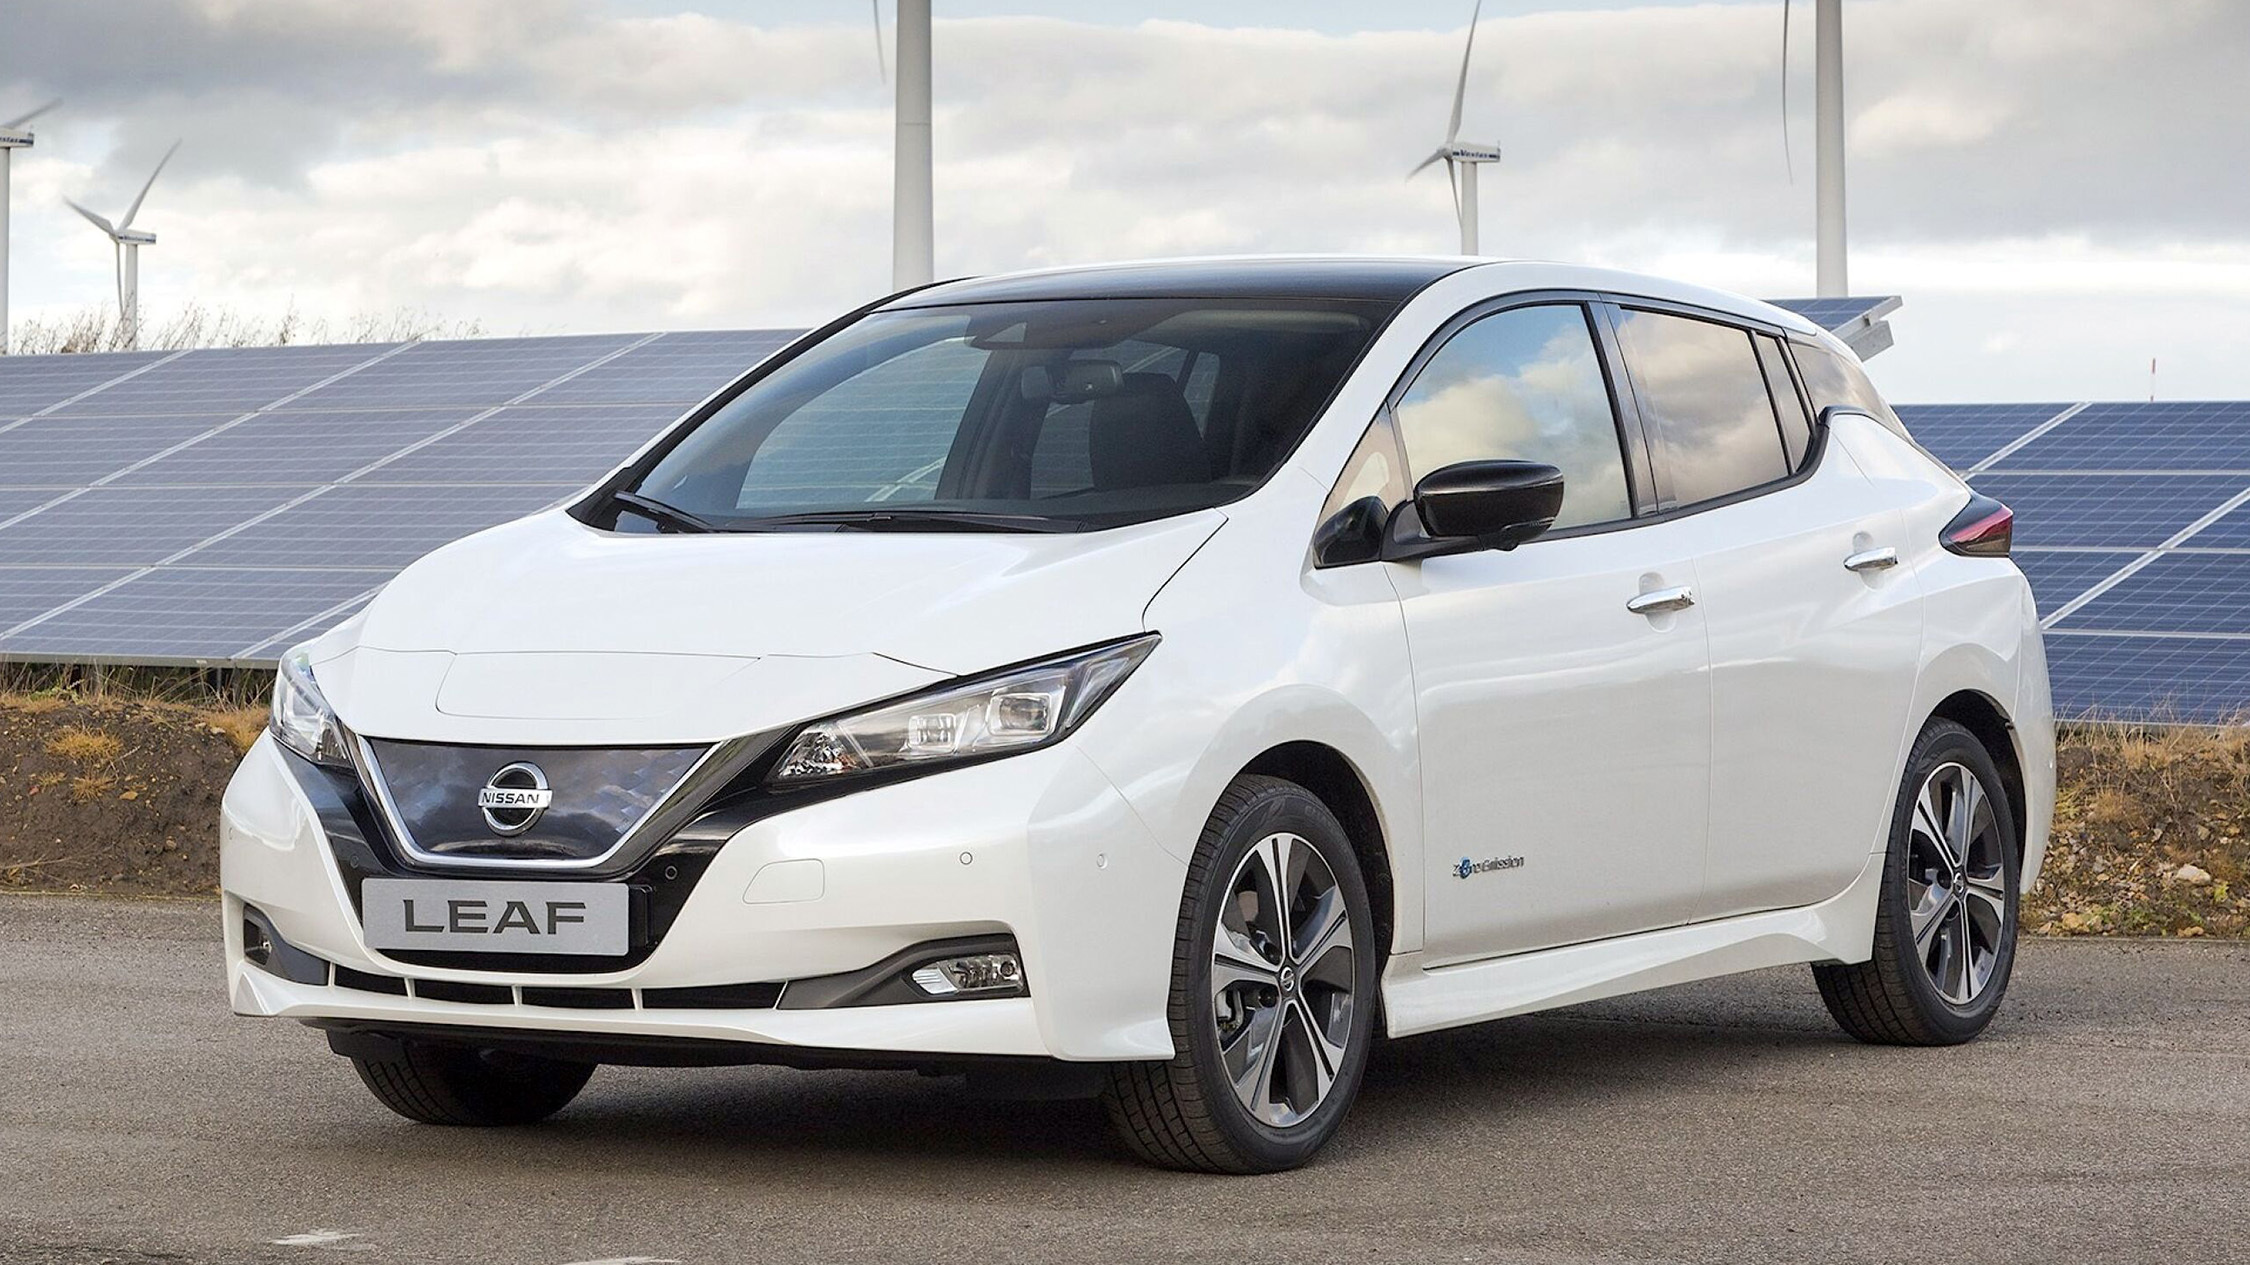
Nissan

Charger And Hummer EV Owners Most Likely To Drink, Speed, And Crash, But A Cheap Kia Stole The Headline

  • GMC Hummer EV drivers top nearly every bad behavior category in new study.
  • Dodge Charger Daytona EV follows close behind in Insurify’s bad-boy rankings.
  • Cybertruck owners crash often, but surprisingly avoid DUIs more frequently.

If we asked you to guess which EVs are most likely to be involved in crashes, attract speeding tickets, or land their drivers with a DUI, our guess is you’d probably start with the GMC Hummer EV and Dodge Charger Daytona. And according to a new study from insurance comparison site Insurify, you’d be absolutely right.

The Hummer EV tops the rankings with a 7.5 percent ticket rate, an 8.3 percent accident rate, and a whopping 6.4 percent DUI rate. Not far behind is the Charger Daytona EV at 7.0 percent, 7.7 percent, and 5.4 percent respectively. Given both EVs pack huge power figures and larger-than-life personalities, neither result comes as a huge surprise.

Related: A Tesla Is Twice As Likely To Reach 250,000 Miles As A Subaru

What’s more unexpected is what comes next. The Kia Soul EV ranks third overall with a 7.1 percent ticket rate, 6.5 percent accident rate, and 4.8 percent DUI rate. The Chevrolet Bolt follows closely behind at 4.8 percent, 4.6 percent, and 4.2 percent.

Neither of those cars is particularly fast or powerful. One possible explanation is demographics. Both have historically appealed to younger and more budget-conscious buyers, groups that statistically tend to take more risks behind the wheel.

Digging deeper into the numbers reveals some interesting outliers. The BMW i5 posts a relatively modest 4.6 percent ticket rate but a hefty 6.7 percent accident rate, one of the highest in the study. Meanwhile, the Chevrolet Blazer EV scores 6.2 percent for tickets and 7.0 percent for accidents, suggesting owners may enjoy using all that instant electric torque.

Cyber-Boozer

 Charger And Hummer EV Owners Most Likely To Drink, Speed, And Crash, But A Cheap Kia Stole The Headline

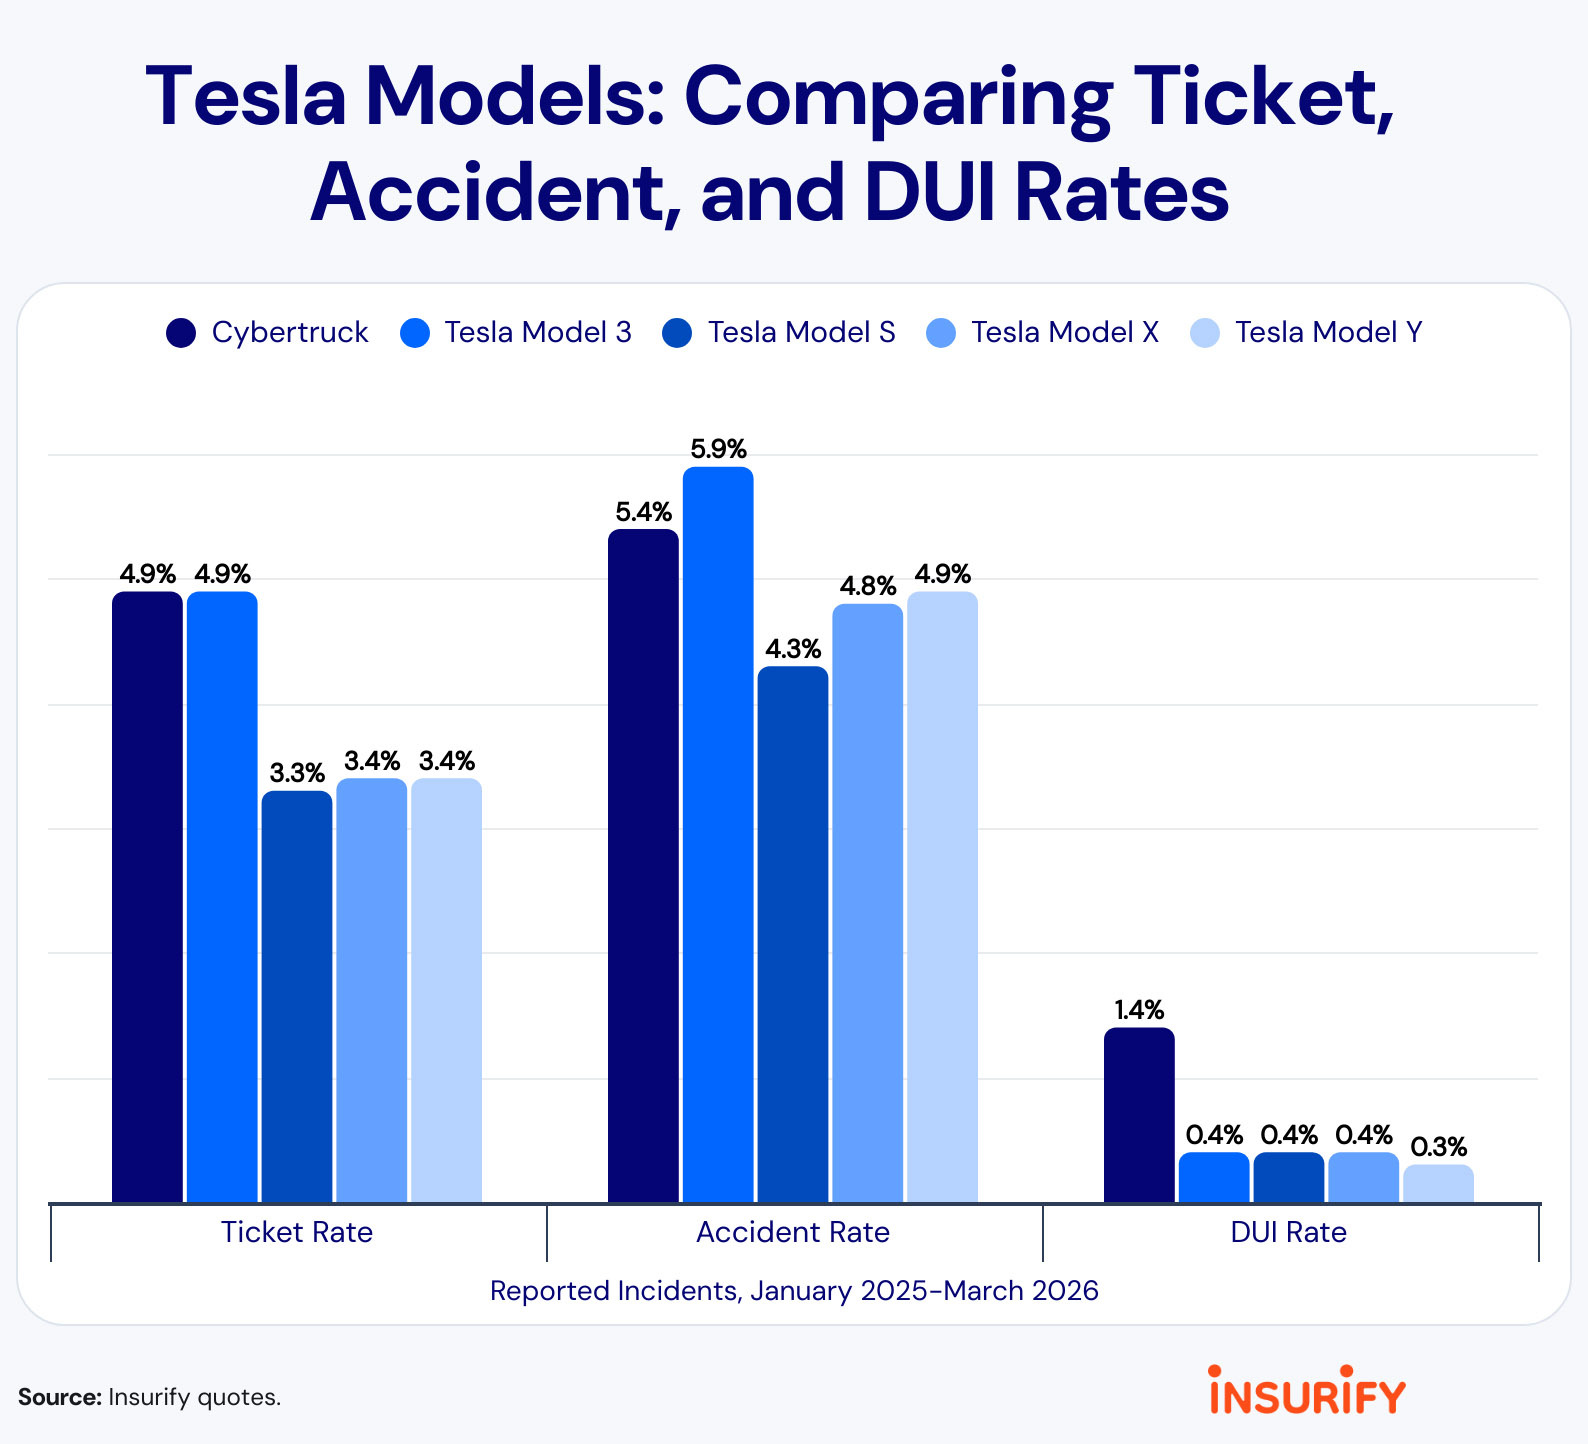
Surprised that Tesla’s Cybertruck didn’t make it to the top of the table? So were we, but it was hardly a saint. The angular pickup records a 4.9 percent ticket rate, which is the same as for a Model 3 and worse than for other Teslas.

The Model 3 is actually more accident-prone at 5.9 percent versus 5.4 percent for the Cybertruck. But Cuybertruck owners clearly like a drink, because their DUI rate (1.4 percent) is much higher than for any other Tesla product. Insurify data shows Model 3, Model S, and Model X drivers all post DUI rates of just 0.4 percent, while Model Y owners come in even lower at 0.3 percent.

EV Ticket, Accident And DUI Rates
EV Make & Model
Ticket
Rate
Accident
Rate
DUI
Rate
GMC Hummer7.5%8.3%6.4%
Dodge Charger Daytona EV7.0%7.7%5.4%
Kia Soul EV7.1%6.5%4.8%
Chevrolet Bolt4.8%4.6%4.2%
GMC Hummer Pickup4.7%5.3%3.9%
Chevrolet Blazer6.2%7.0%3.8%
Chevy Brightdrop 6003.9%4.4%3.4%
Chevrolet Bolt EUV5.1%6.2%3.1%
Kia EV94.4%4.9%2.3%
BMW i54.6%6.7%2.1%
GMC Hummer SUV2.6%3.2%1.8%
Tesla Cybertruck4.9%5.4%1.4%
Hyundai IONIQ 53.4%5.2%1.3%
Chevrolet Bolt EV2.9%3.8%1.3%
Jeep Wagoneer S2.6%2.8%1.2%
Honda Clarity1.8%2.7%1.2%
Hyundai IONIQ 62.5%4.0%1.1%
Mercedes EQS Sedan2.6%2.7%1.0%
Ford Focus5.6%6.4%0.8%
Hyundai IONIQ1.6%2.6%0.8%
Toyota BZ4X2.4%3.6%0.7%
Kia EV62.9%4.0%0.7%
Mercedes EQS-Class3.9%4.6%0.7%
Ford Ranger3.2%4.1%0.6%
Nissan Ariya2.6%4.2%0.6%
Honda Prologue3.1%5.3%0.6%
Toyota RAV43.2%4.4%0.6%
Kia Niro3.1%5.2%0.5%
Hyundai Kona4.2%6.1%0.5%
Tesla Model 34.9%5.9%0.4%
Ford Mustang Mach-E4.0%5.5%0.4%
Nissan Leaf2.3%3.7%0.4%
Tesla Model S3.3%4.3%0.4%
Tesla Model X3.4%4.8%0.4%
Chevrolet Equinox3.1%4.8%0.3%
Tesla Model Y3.4%4.9%0.3%
Ford F-Series Pickup1.6%2.1%0.3%
Volkswagen ID.43.1%4.8%0.3%
Chevrolet Silverado1.5%1.9%0.2%
SWIPE

Insurify, GM, Dodge

Charger And Hummer EV Owners Most Likely To Drink, Speed, And Crash, But A Cheap Kia Stole The Headline

  • GMC Hummer EV drivers top nearly every bad behavior category in new study.
  • Dodge Charger Daytona EV follows close behind in Insurify’s bad-boy rankings.
  • Cybertruck owners crash often, but surprisingly avoid DUIs more frequently.

If we asked you to guess which EVs are most likely to be involved in crashes, attract speeding tickets, or land their drivers with a DUI, our guess is you’d probably start with the GMC Hummer EV and Dodge Charger Daytona. And according to a new study from insurance comparison site Insurify, you’d be absolutely right.

The Hummer EV tops the rankings with a 7.5 percent ticket rate, an 8.3 percent accident rate, and a whopping 6.4 percent DUI rate. Not far behind is the Charger Daytona EV at 7.0 percent, 7.7 percent, and 5.4 percent respectively. Given both EVs pack huge power figures and larger-than-life personalities, neither result comes as a huge surprise.

Related: A Tesla Is Twice As Likely To Reach 250,000 Miles As A Subaru

What’s more unexpected is what comes next. The Kia Soul EV ranks third overall with a 7.1 percent ticket rate, 6.5 percent accident rate, and 4.8 percent DUI rate. The Chevrolet Bolt follows closely behind at 4.8 percent, 4.6 percent, and 4.2 percent.

Neither of those cars is particularly fast or powerful. One possible explanation is demographics. Both have historically appealed to younger and more budget-conscious buyers, groups that statistically tend to take more risks behind the wheel.

Digging deeper into the numbers reveals some interesting outliers. The BMW i5 posts a relatively modest 4.6 percent ticket rate but a hefty 6.7 percent accident rate, one of the highest in the study. Meanwhile, the Chevrolet Blazer EV scores 6.2 percent for tickets and 7.0 percent for accidents, suggesting owners may enjoy using all that instant electric torque.

Cyber-Boozer

 Charger And Hummer EV Owners Most Likely To Drink, Speed, And Crash, But A Cheap Kia Stole The Headline

Surprised that Tesla’s Cybertruck didn’t make it to the top of the table? So were we, but it was hardly a saint. The angular pickup records a 4.9 percent ticket rate, which is the same as for a Model 3 and worse than for other Teslas.

The Model 3 is actually more accident-prone at 5.9 percent versus 5.4 percent for the Cybertruck. But Cuybertruck owners clearly like a drink, because their DUI rate (1.4 percent) is much higher than for any other Tesla product. Insurify data shows Model 3, Model S, and Model X drivers all post DUI rates of just 0.4 percent, while Model Y owners come in even lower at 0.3 percent.

EV Ticket, Accident And DUI Rates
EV Make & Model
Ticket
Rate
Accident
Rate
DUI
Rate
GMC Hummer7.5%8.3%6.4%
Dodge Charger Daytona EV7.0%7.7%5.4%
Kia Soul EV7.1%6.5%4.8%
Chevrolet Bolt4.8%4.6%4.2%
GMC Hummer Pickup4.7%5.3%3.9%
Chevrolet Blazer6.2%7.0%3.8%
Chevy Brightdrop 6003.9%4.4%3.4%
Chevrolet Bolt EUV5.1%6.2%3.1%
Kia EV94.4%4.9%2.3%
BMW i54.6%6.7%2.1%
GMC Hummer SUV2.6%3.2%1.8%
Tesla Cybertruck4.9%5.4%1.4%
Hyundai IONIQ 53.4%5.2%1.3%
Chevrolet Bolt EV2.9%3.8%1.3%
Jeep Wagoneer S2.6%2.8%1.2%
Honda Clarity1.8%2.7%1.2%
Hyundai IONIQ 62.5%4.0%1.1%
Mercedes EQS Sedan2.6%2.7%1.0%
Ford Focus5.6%6.4%0.8%
Hyundai IONIQ1.6%2.6%0.8%
Toyota BZ4X2.4%3.6%0.7%
Kia EV62.9%4.0%0.7%
Mercedes EQS-Class3.9%4.6%0.7%
Ford Ranger3.2%4.1%0.6%
Nissan Ariya2.6%4.2%0.6%
Honda Prologue3.1%5.3%0.6%
Toyota RAV43.2%4.4%0.6%
Kia Niro3.1%5.2%0.5%
Hyundai Kona4.2%6.1%0.5%
Tesla Model 34.9%5.9%0.4%
Ford Mustang Mach-E4.0%5.5%0.4%
Nissan Leaf2.3%3.7%0.4%
Tesla Model S3.3%4.3%0.4%
Tesla Model X3.4%4.8%0.4%
Chevrolet Equinox3.1%4.8%0.3%
Tesla Model Y3.4%4.9%0.3%
Ford F-Series Pickup1.6%2.1%0.3%
Volkswagen ID.43.1%4.8%0.3%
Chevrolet Silverado1.5%1.9%0.2%
SWIPE

Insurify, GM, Dodge

BMW Beat 23 Other EVs In Range, Then Beat Its Own Too

  • BMW iX3 went the furthest of any EV in Norway’s summer test.
  • Xpeng X9 minivan beat its official range by a wide margin.
  • Most of the 24 EVs barely strayed from their stated range figures.

Most modern EVs look like long-haul champions on the spec sheet, but the paper numbers and the real world don’t always shake hands. The Norwegian Automobile Federation (NAF) and its independent membership magazine Motor are back with the bi-annual “El Prix” range test, putting 24 electric models through their paces to see which ones live up to their official WLTP ratings, and which ones fall flat.

This round was run under the kindest conditions an EV could ask for. NAF conducted the test during the Norwegian summer, with dry roads and temperatures hovering between 12 and 18°C (53.6 to 64.4°F).

More: EV Range Claims Still Sound Great, Until Freezing Temps Hit

The standout was the new BMW iX3 50 xDrive, which covered 781 km (485 miles) on a single charge. That’s not just close to its claim, it’s 1.5 percent beyond its official WLTP figure and a hefty 11.7 percent more than its advertised EPA range.

 BMW Beat 23 Other EVs In Range, Then Beat Its Own Too
BMW iX3

Predictably, the new iX3 posted a much higher range figure than the model it replaces. Even so, NAF points out that the previous-gen iX3 tested back in 2021 still holds the all-time summer record for positive deviation, beating its rating by 23.5 percent with 556 km (345 miles) of range.

More: EV Speed Comes At A Price, So Where’s The Sweet Spot?

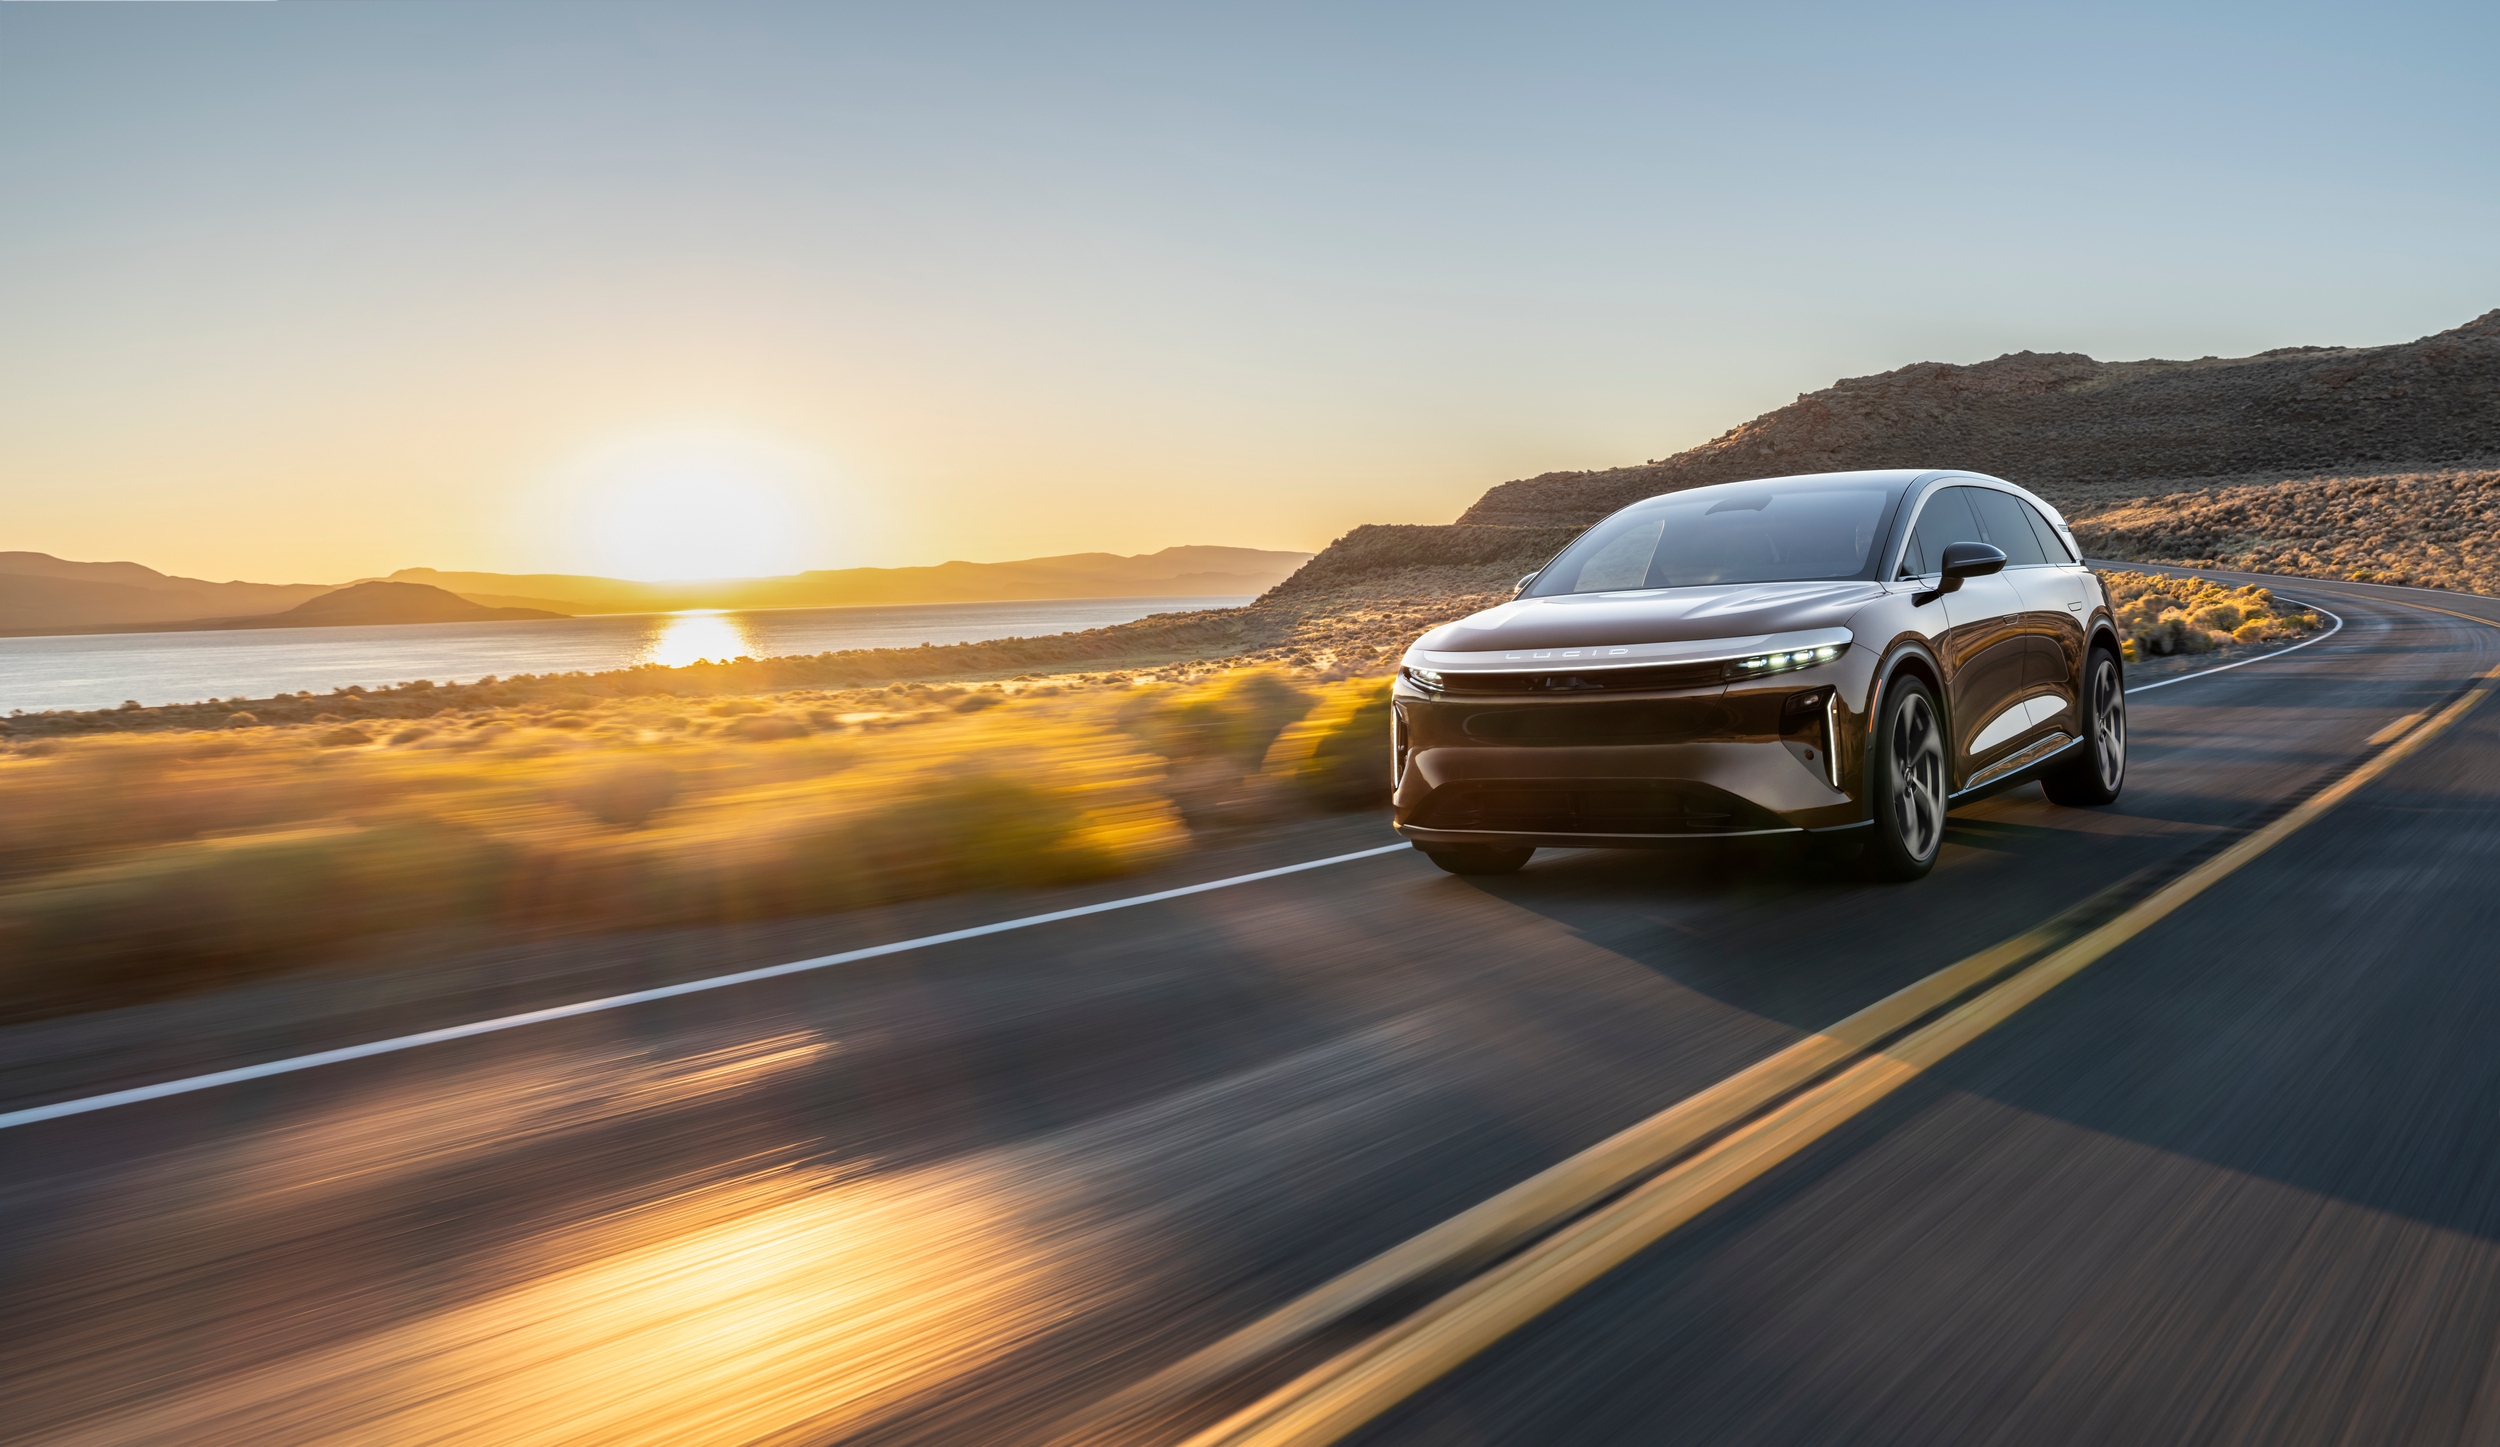
As for the ultimate record for the longest range, it belongs to the Lucid Air that achieved 832 km (517 miles) in the summer of 2025. This year Lucid showed up with the Gravity SUV instead, which ran for 720 km (447 miles) before the battery gave out, falling 3.7 percent short of its expected figure.

 BMW Beat 23 Other EVs In Range, Then Beat Its Own Too
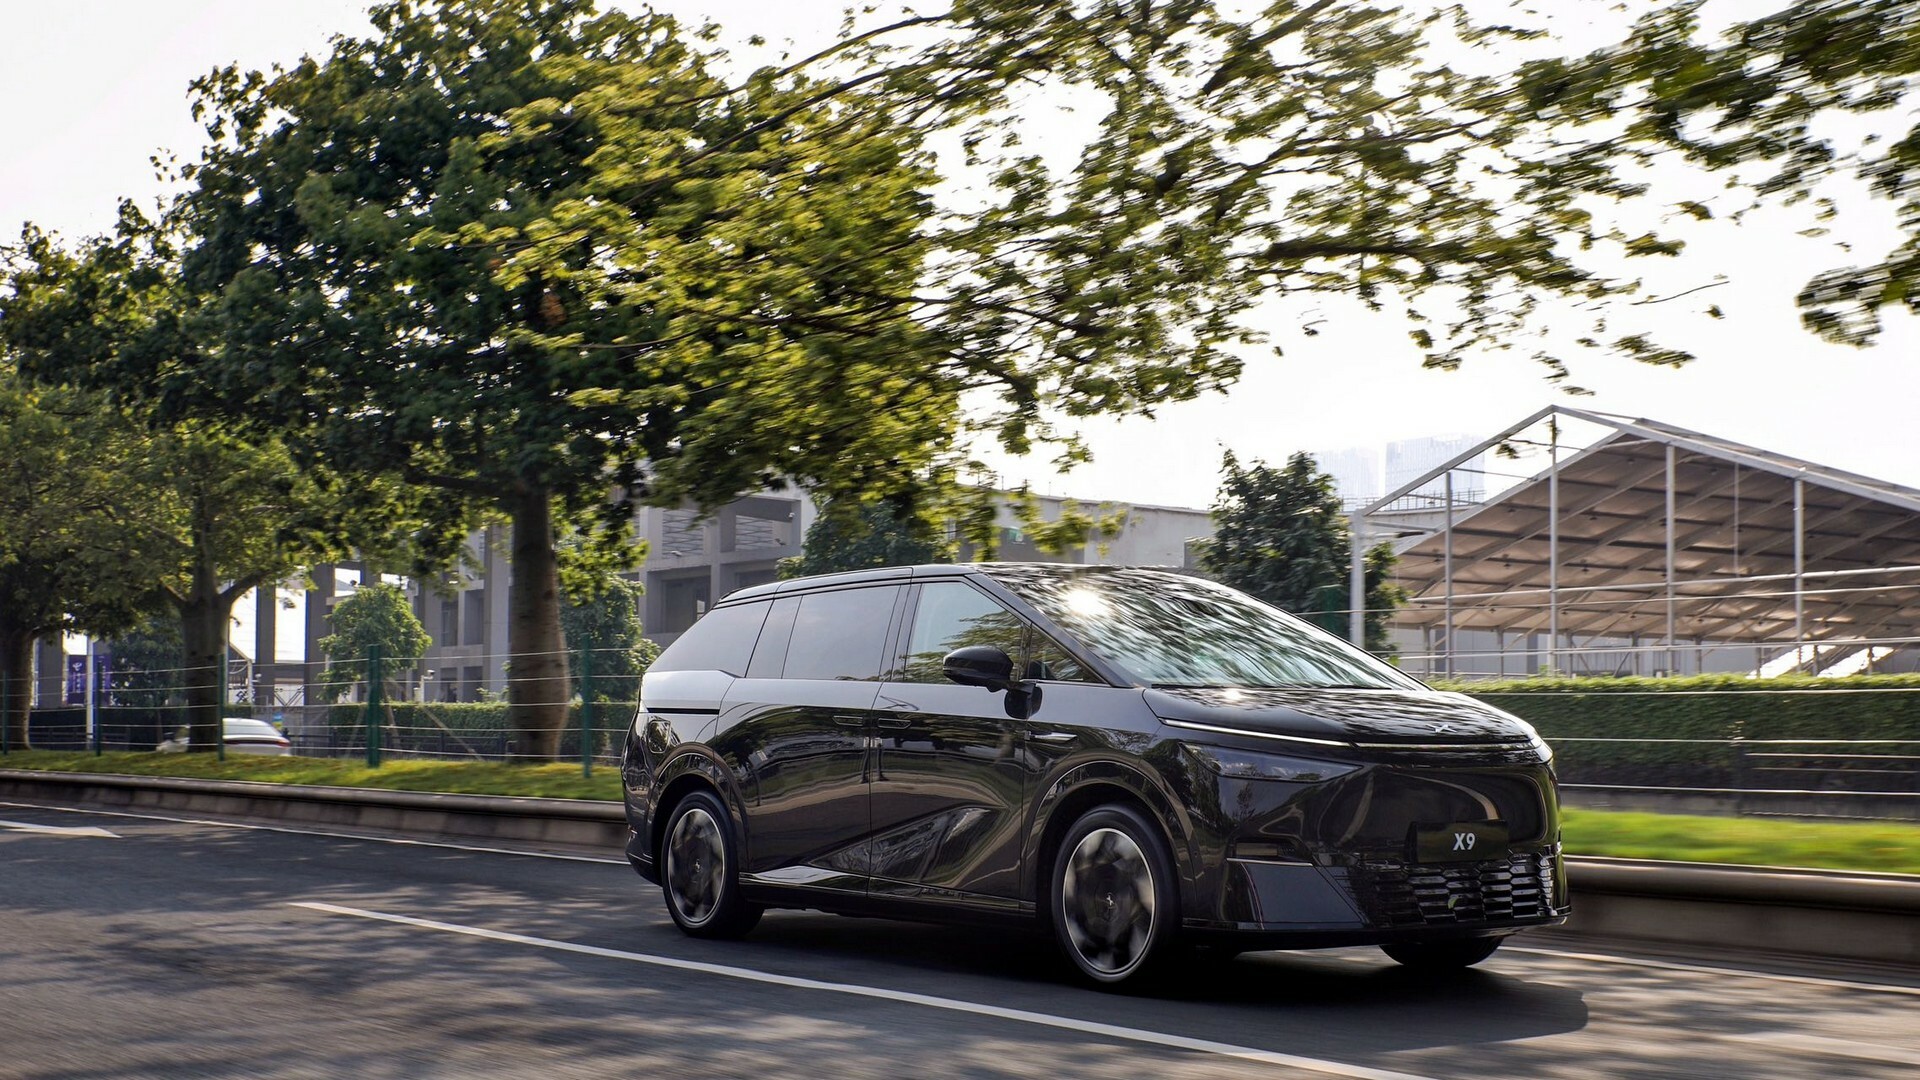
Xpeng X9

The BMW drove the furthest, but the most impressive result of the year came from the XPeng X9. The Chinese minivan posted a real-world range of 646 km (401 miles), beating its WLTP rating of 580 km (360 miles) by 11.4 percent. That kind of overachievement is nothing new for XPeng, as the G9 SUV topped its advertised range by 13 percent back in the 2023 test.

More: This EV’s Real Range Misses By 23% But That’s Not The Worst Part

At the opposite end sat another Chinese model, the MG IM6 sedan, which managed just 446 km (277 miles), falling 11.7 percent short of its WLTP figure. Nils Sødal, senior communications adviser at NAF, said the result caught the team off guard: “We were surprised to see such a large negative deviation for this MG, especially when the other MG model, the S6, achieved a positive deviation of 3.4 per cent.”

The rest of the field stayed within a tight band, deviating from their stated range by anywhere from -5.7 to +5.4 percent, helped along by the dry roads and mild summer temperatures.

 BMW Beat 23 Other EVs In Range, Then Beat Its Own Too
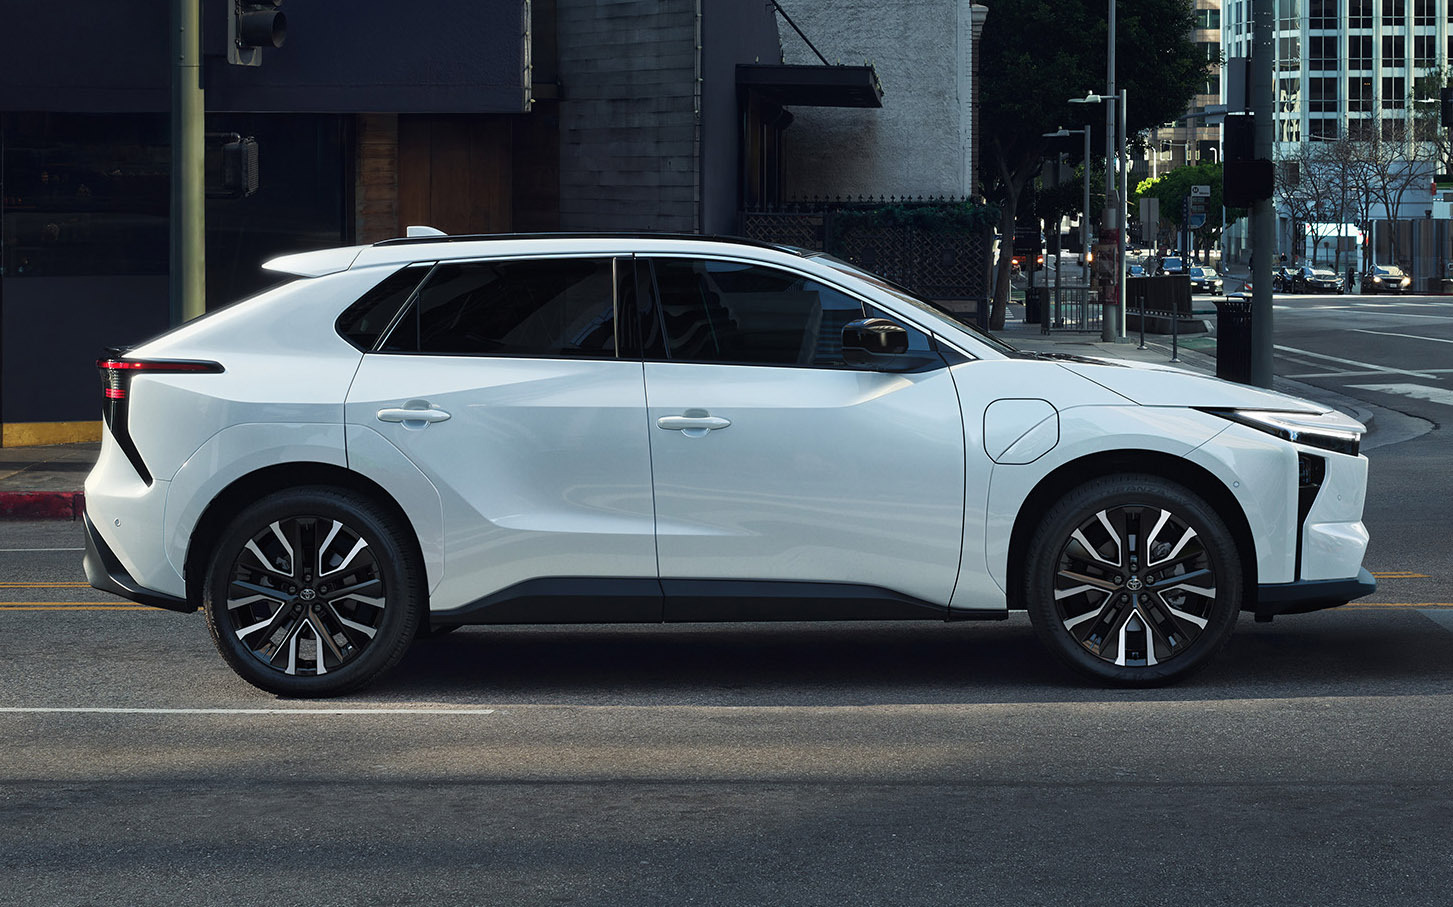
Toyota bZ (bZ4 in Europe)

Interestingly, the facelifted Toyota bZ4X perfectly matched its WLTP figure of 506 km (314 miles) on the real-world test. However, the driver stated that the Japanese model showed 0% remaining battery 18 km (11 miles) before it actually ran dry. Keep in mind that NAF pushes these EVs to their absolute limit, driving each one until it’s completely discharged.

Below you can see the results for the full batch of 24 EVs that took part in the summer 2026 edition of the “El Prix,” ranked from the longest to the shortest range on a single charge.

Test Results
ModelWLTP Stated RangeReal-World Range Deviation
BMW iX3770 km (478 miles)781 km (485 miles)+1.5%
Lucid Gravity748 km (465 miles)720 km (447 miles)-3.7%
Mercedes-Benz CLA708 km (440 miles)675 km (419 miles)-4.7%
Mercedes-Benz GLC 400643 km (400 miles)665 km (413 miles)+3.4%
Xpeng X9580 km (360 miles)646 km (401 miles)+11.4%
Polestar 3625 km (388 miles)601 km (373 miles)-3.8%
Mercedes-Benz GLB 350563 km (350 miles)593 km (368 miles)+5.3%
Toyota C-HR+607 km (377 miles)587 km (365 miles)-3.4%
Kia EV4594 km (369 miles)575 km (357 miles)-3.3%
Hyundai Ioniq 9600 km (373 miles)566 km (352 miles)-5.7%
Smart #5540 km (336 miles)556 km (345 miles)+3%
Kia EV5520 km (323 miles)509 km (316 miles)-2.1%
Toyota bZ4X506 km (314 miles)506 km (314 miles)
MG S6485 km (301 miles)502 km (312 miles)+3.4%
Citroen E-C5 Aircross513 km (319 miles)500 km (311 miles)-2.5%
Mazda 6e479 km (298 miles)485 km (301 miles)+1.2%
BYD Atto EVO470 km (292 miles)460 km (286 miles)-2.1%
MG IM6505 km (314 miles)446 km (277 miles)-11.7%
Changan Deepal S05445 km (277 miles)431 km (268 miles)-3.1%
Kia PV5412 km (256 miles)420 km (261 miles)+1.8%
Hyundai Inster360 km (224 miles)373 km (232 miles)+3.5%
KGM Musso379 km (235 miles)369 km (229 miles)-2.6%
Dongfeng Vigo340 km (211 miles)348 km (216 miles)+2.3%
Kia EV2308 km (191 miles)325 km (202 miles)+5.4%
SWIPE
 BMW Beat 23 Other EVs In Range, Then Beat Its Own Too
Lucid Gravity

Charging An EV Cost $11 More This Year, Filling A Sequoia Cost $1,623 More

  • Gas prices jumped 46 percent in four months, hitting traditional vehicles the hardest.
  • EV annual energy costs barely moved while gas vehicles saw a $706 average increase.
  • Large SUVs, trucks, and minivans got hammered, with some owners facing $1,600+ jumps.

Gas prices have a way of fading into the background when they’re stable. Then they spike, and suddenly every fill-up feels like a minor financial crisis. Drivers of thirsty trucks and body-on-frame SUVs know the feeling all too well. A new study suggests 2026 has turned into one of those years where fuel costs go from annoyance to budget item almost overnight.

According to a new study from iSeeCars, gasoline prices climbed nearly 46 percent between January and April, moving from $2.81 to $4.10 per gallon. The picture has only worsened since. At the time of publishing on May 24, the national average sits at $4.52 for regular, $5.01 for mid-grade, $5.39 for premium, and $5.62 for diesel.

Even working from the smaller January-to-April window the study covers, the math is ugly: an average annual fuel-cost increase of $706 for traditional gas-powered vehicles. EV drivers, meanwhile, barely felt it, with annual charging costs up just $11.

Fuel Cost Increase By Drivetrain: Jan vs. Apr 2026
DrivetrainAvg. Miles
Per Year
Annual Fuel
Cost Jan-26
Annual Fuel
Cost Apr-26
Diff.
ICE13,323$1,533$2,240$706
Hybrid14,696$1,055$1,540$486
PHEV11,660$1,385$1,676$291
EV11,880$714$725$11
SWIPE

iSeeCars

The data comes from an analysis of more than 2.1 million three-year-old used vehicles sold in 2025. Researchers looked at average annual mileage and paired it with fuel costs in January and April to estimate how much ownership costs changed in just four months.

Read: As Gas Prices Soar, Here’s How To Cut Your Fuel Bill Now

The hit landed unevenly across powertrains. Internal-combustion vehicles were hit the hardest, jumping from $1,533 to $2,240 in annual fuel costs. Hybrids took a smaller hit, rising $486. Plug-in hybrids landed in the middle with a $291 increase. EVs barely moved at all, increasing from $714 to $725 annually, and that’s even more impressive when you consider that the study didn’t just sample drivers who can charge at home.

Fuel Cost Increase for Major Gas Vehicle Segments: Jan vs. Apr 2026
SegmentAvg. Miles
Per Year
Annual Fuel
Cost Jan-26
Annual Fuel
Cost Apr-26
Diff.
Minivans19,292$2,472$3,610$1,139
Trucks14,369$2,154$3,146$992
SUVs12,731$1,479$2,161$681
Passenger Cars13,714$1,316$1,922$606
SWIPE

iSeeCars

Here’s the kicker. Efficiency alone wasn’t the whole story. Mileage played a huge role, too. Minivans, surprisingly, took the biggest hit of any segment. Annual fuel costs rose by $1,139, climbing to $3,610. Of course, a big piece of that is how much most minivans (save for the VW ID.Buzz) are built for lots of miles. Trucks with their comical fuel economy and brick-like drag coefficient weren’t far behind with a $992 jump.

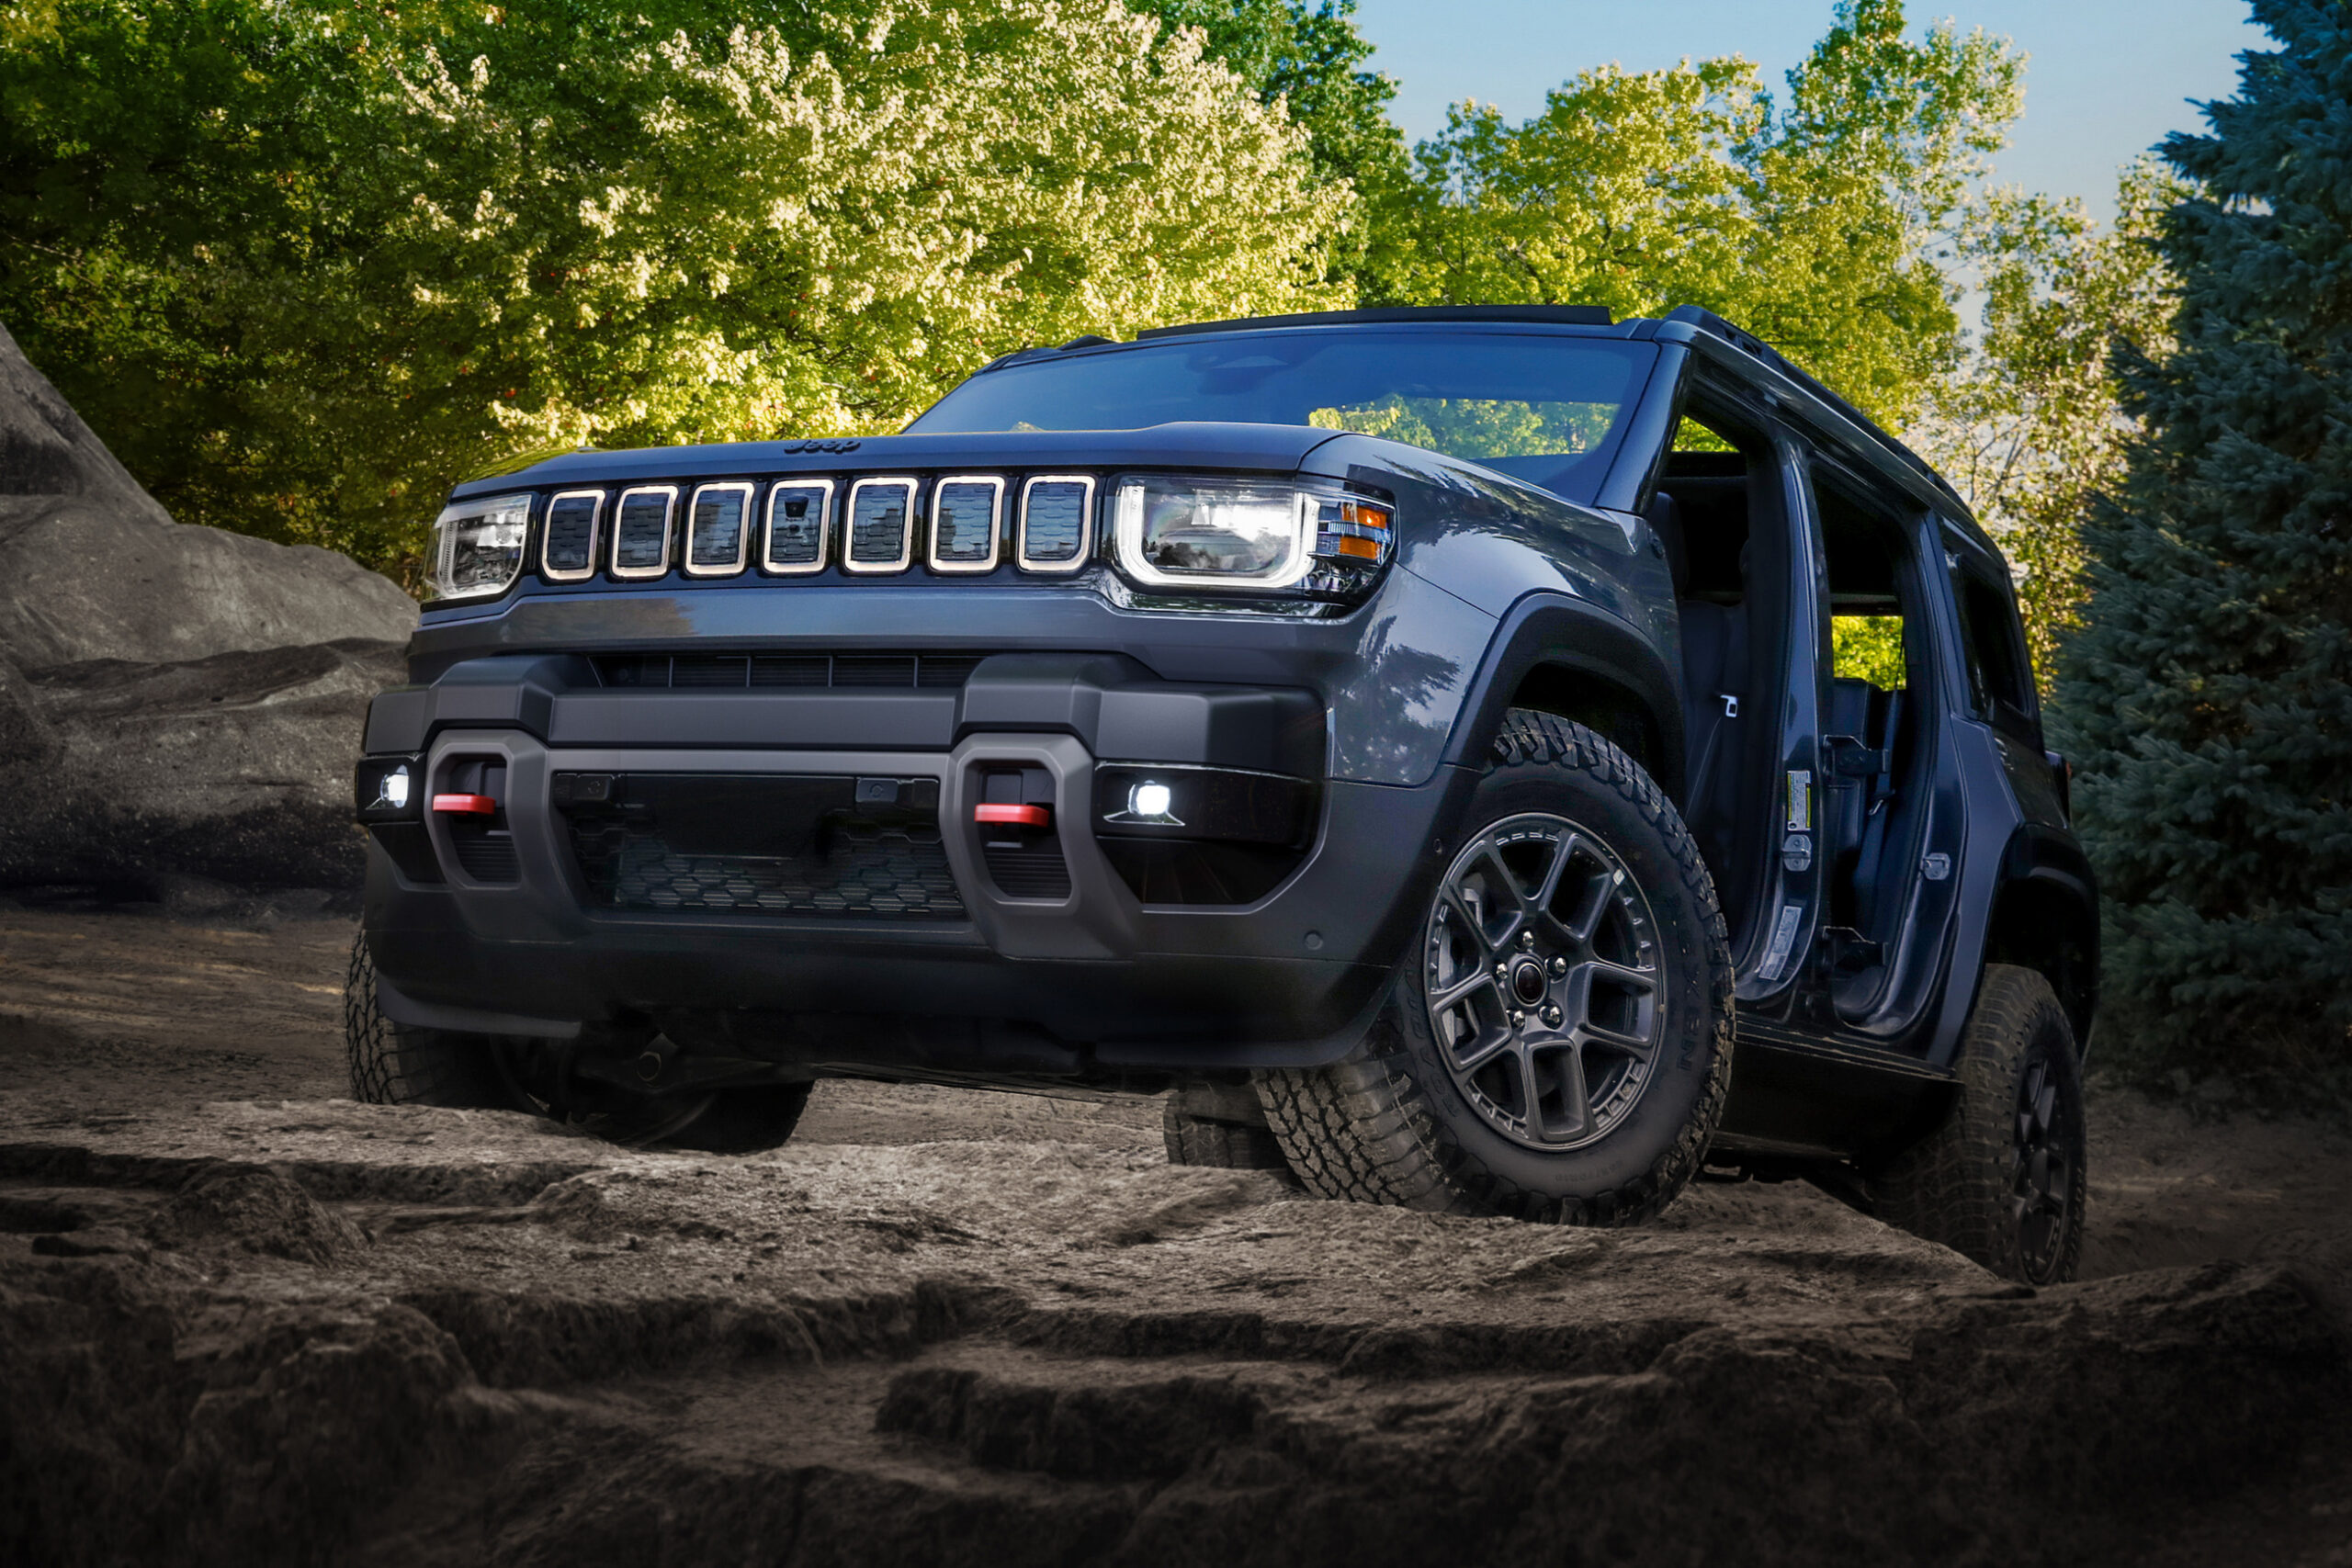
SUV owners were almost karmically hit the hardest, with the Toyota Sequoia topping the charts at an average $1,623 increase. The Chevrolet Suburban came in second with $1,542, and the top three rounded out with the Nissan Armada at $1,513. Zoom out, and this may explain why hybrids continue gaining traction. They avoid the range anxiety and charging headaches some buyers still worry about, while taking a lot of the sting out of gas-price roulette.

Top 10 Vehicles With the Biggest Fuel Cost Increases
RankModelAvg. Miles
Per Year
Annual Fuel
Cost Jan-26
Annual Fuel
Cost Apr-26
Diff.
1Toyota Sequoia17,856$3,523$5,145$1,623
2Chevrolet Suburban19,626$3,347$4,889$1,542
3Nissan Armada18,098$3,284$4,797$1,513
4GMC Yukon XL18,734$3,193$4,664$1,471
5Chevrolet Tahoe16,727$2,860$4,177$1,317
6Cadillac Escalade ESV16,387$2,847$4,159$1,312
7GMC Yukon16,592$2,831$4,135$1,304
8Jeep Wagoneer16,975$2,782$4,064$1,282
9GMC Sierra 1500 Limited17,069$2,772$4,050$1,277
10Chrysler Pacifica20,872$2,682$3,918$1,236
ICE Average13,323$1,533$2,240$706
SWIPE

iSeeCars

❌
❌