BMW Beat 23 Other EVs In Range, Then Beat Its Own Too
- BMW iX3 went the furthest of any EV in Norway’s summer test.
- Xpeng X9 minivan beat its official range by a wide margin.
- Most of the 24 EVs barely strayed from their stated range figures.
Most modern EVs look like long-haul champions on the spec sheet, but the paper numbers and the real world don’t always shake hands. The Norwegian Automobile Federation (NAF) and its independent membership magazine Motor are back with the bi-annual “El Prix” range test, putting 24 electric models through their paces to see which ones live up to their official WLTP ratings, and which ones fall flat.
This round was run under the kindest conditions an EV could ask for. NAF conducted the test during the Norwegian summer, with dry roads and temperatures hovering between 12 and 18°C (53.6 to 64.4°F).
More: EV Range Claims Still Sound Great, Until Freezing Temps Hit
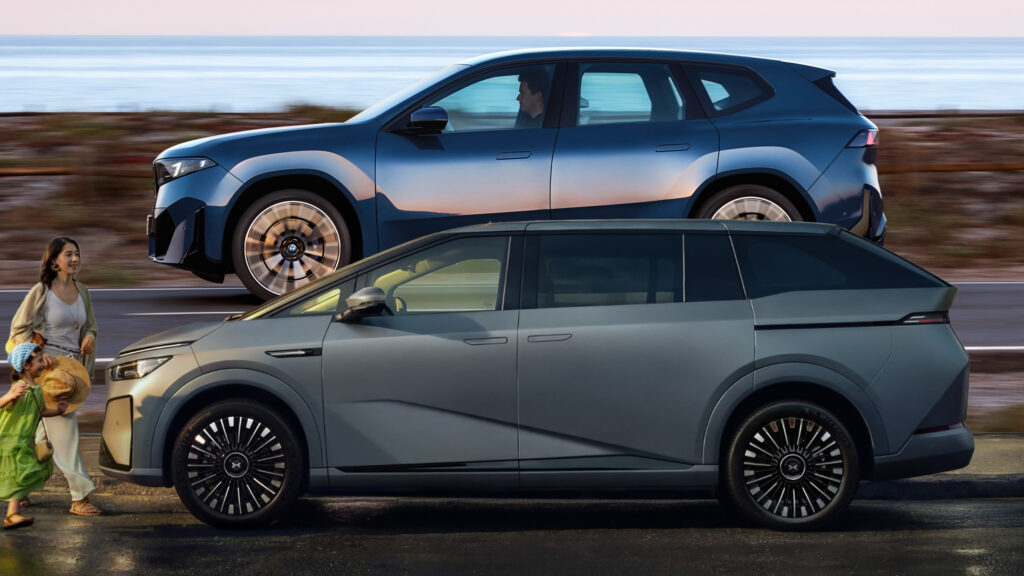
The standout was the new BMW iX3 50 xDrive, which covered 781 km (485 miles) on a single charge. That’s not just close to its claim, it’s 1.5 percent beyond its official WLTP figure and a hefty 11.7 percent more than its advertised EPA range.

Predictably, the new iX3 posted a much higher range figure than the model it replaces. Even so, NAF points out that the previous-gen iX3 tested back in 2021 still holds the all-time summer record for positive deviation, beating its rating by 23.5 percent with 556 km (345 miles) of range.
More: EV Speed Comes At A Price, So Where’s The Sweet Spot?
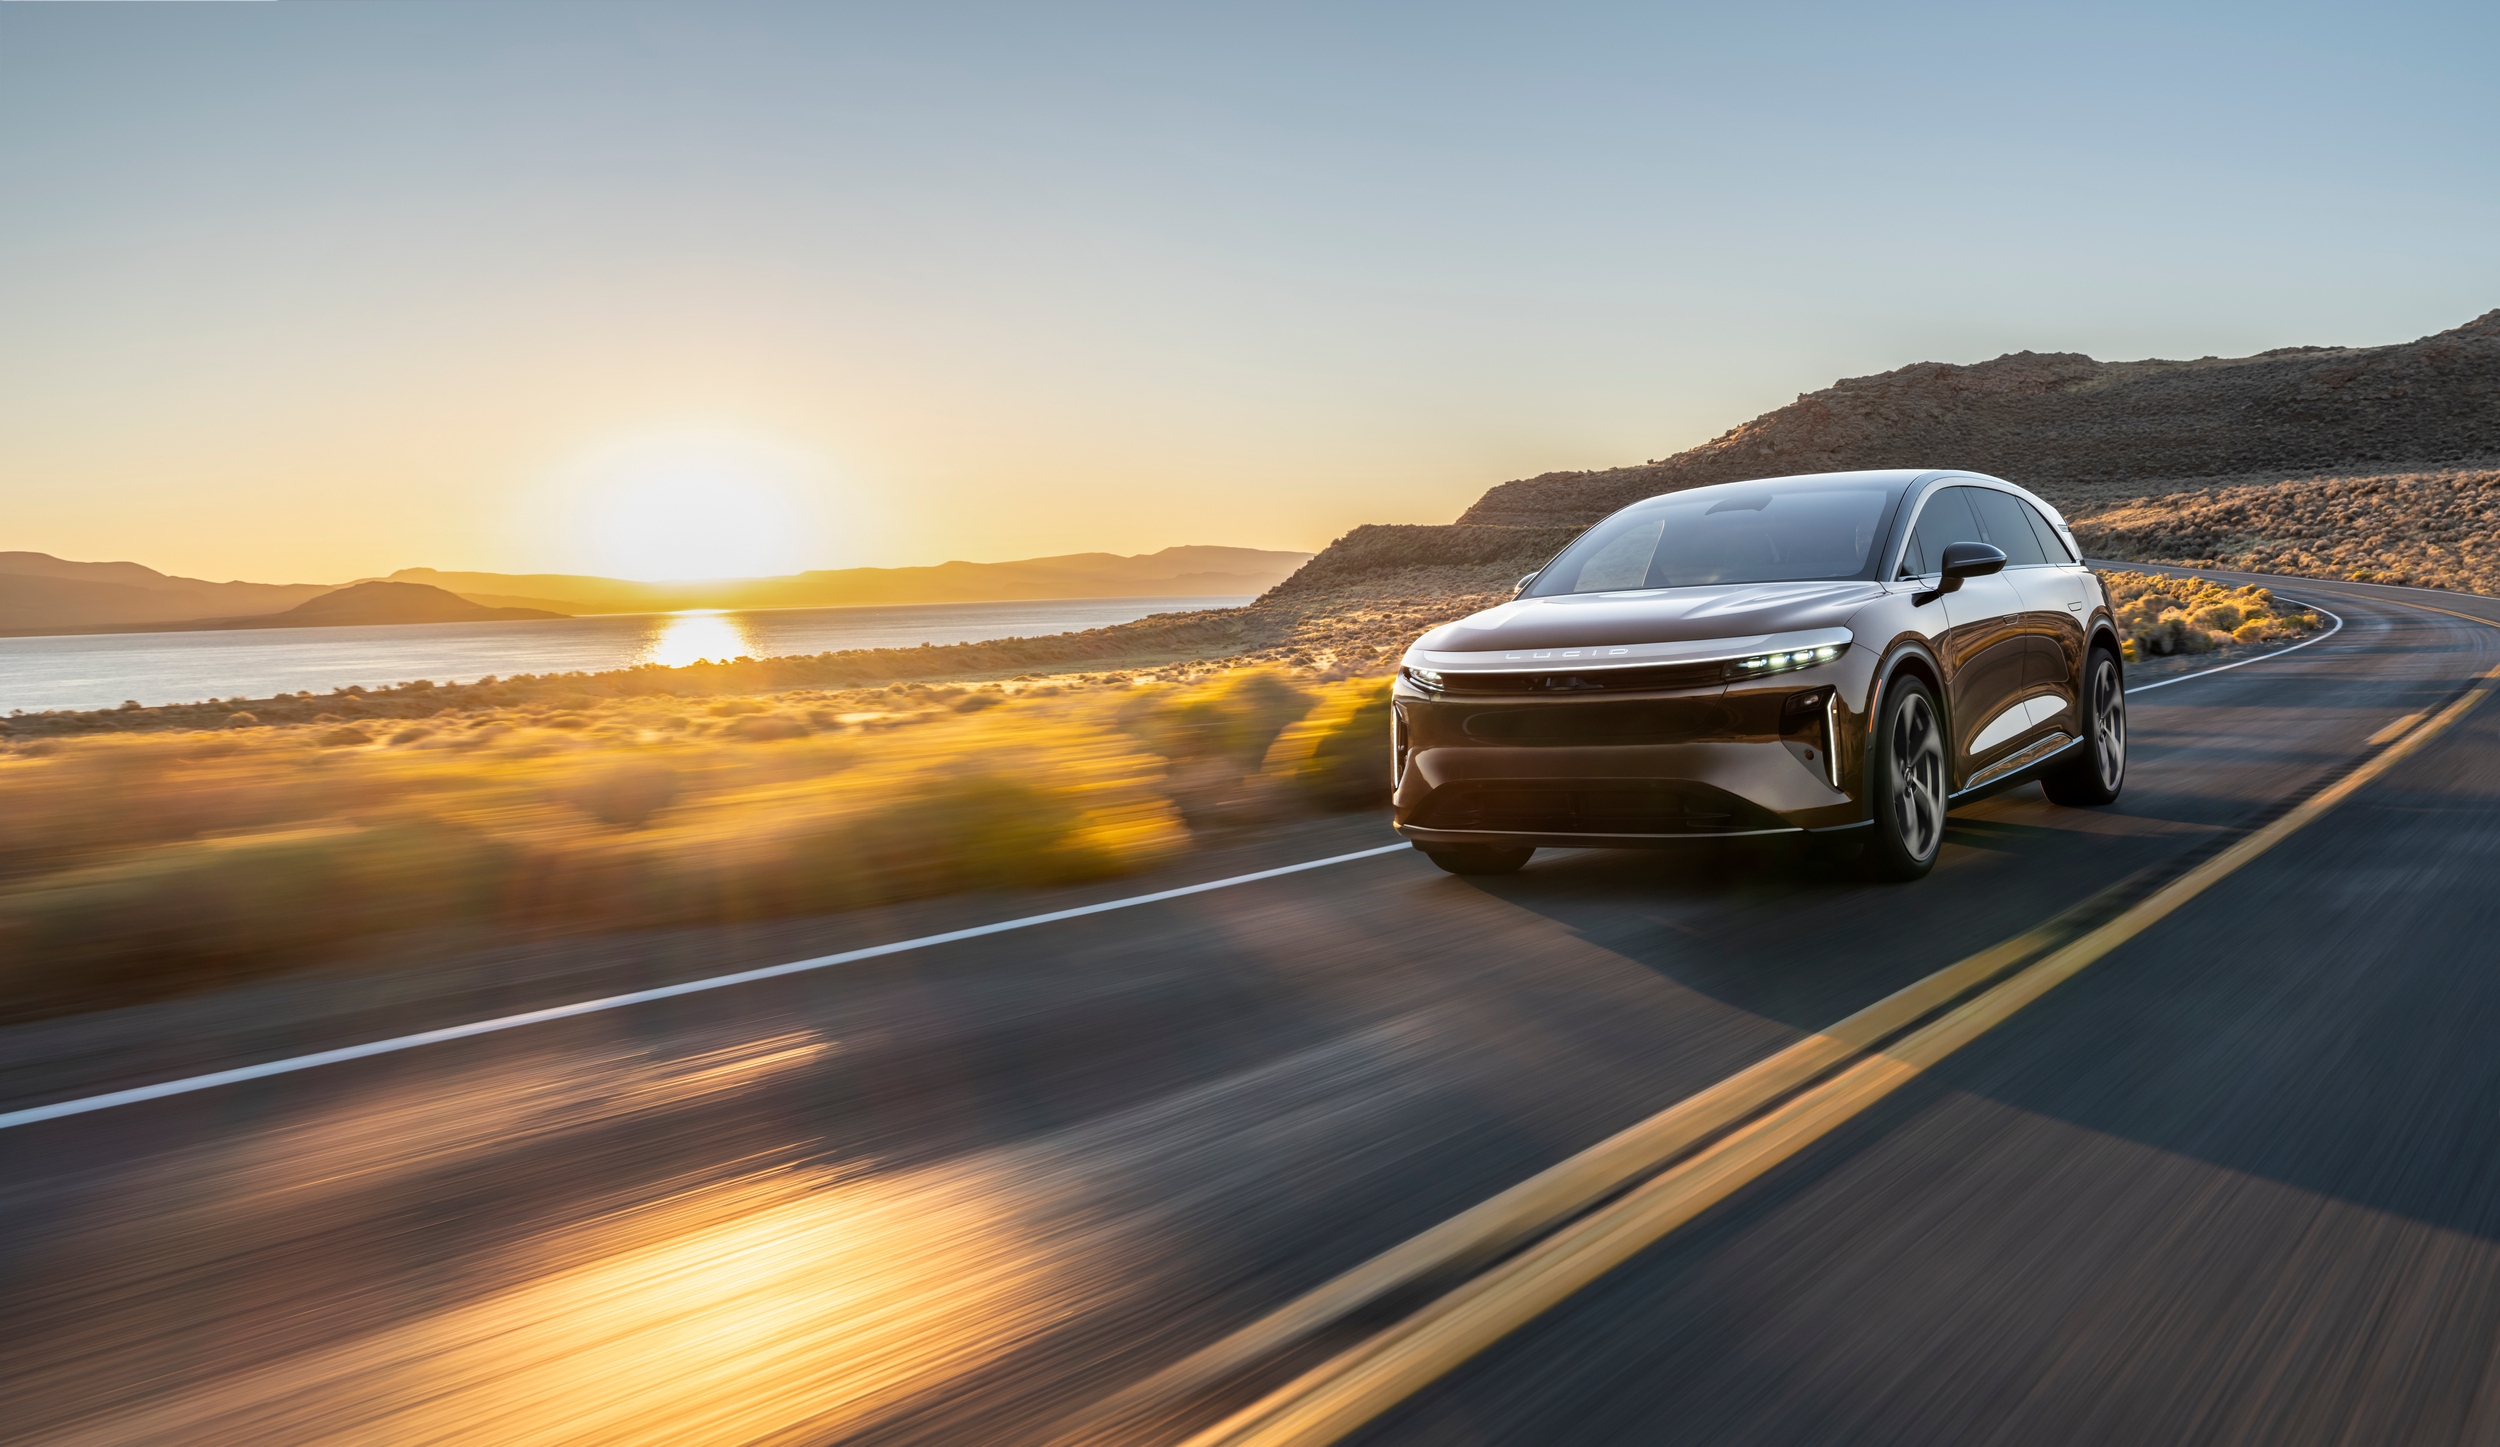
As for the ultimate record for the longest range, it belongs to the Lucid Air that achieved 832 km (517 miles) in the summer of 2025. This year Lucid showed up with the Gravity SUV instead, which ran for 720 km (447 miles) before the battery gave out, falling 3.7 percent short of its expected figure.
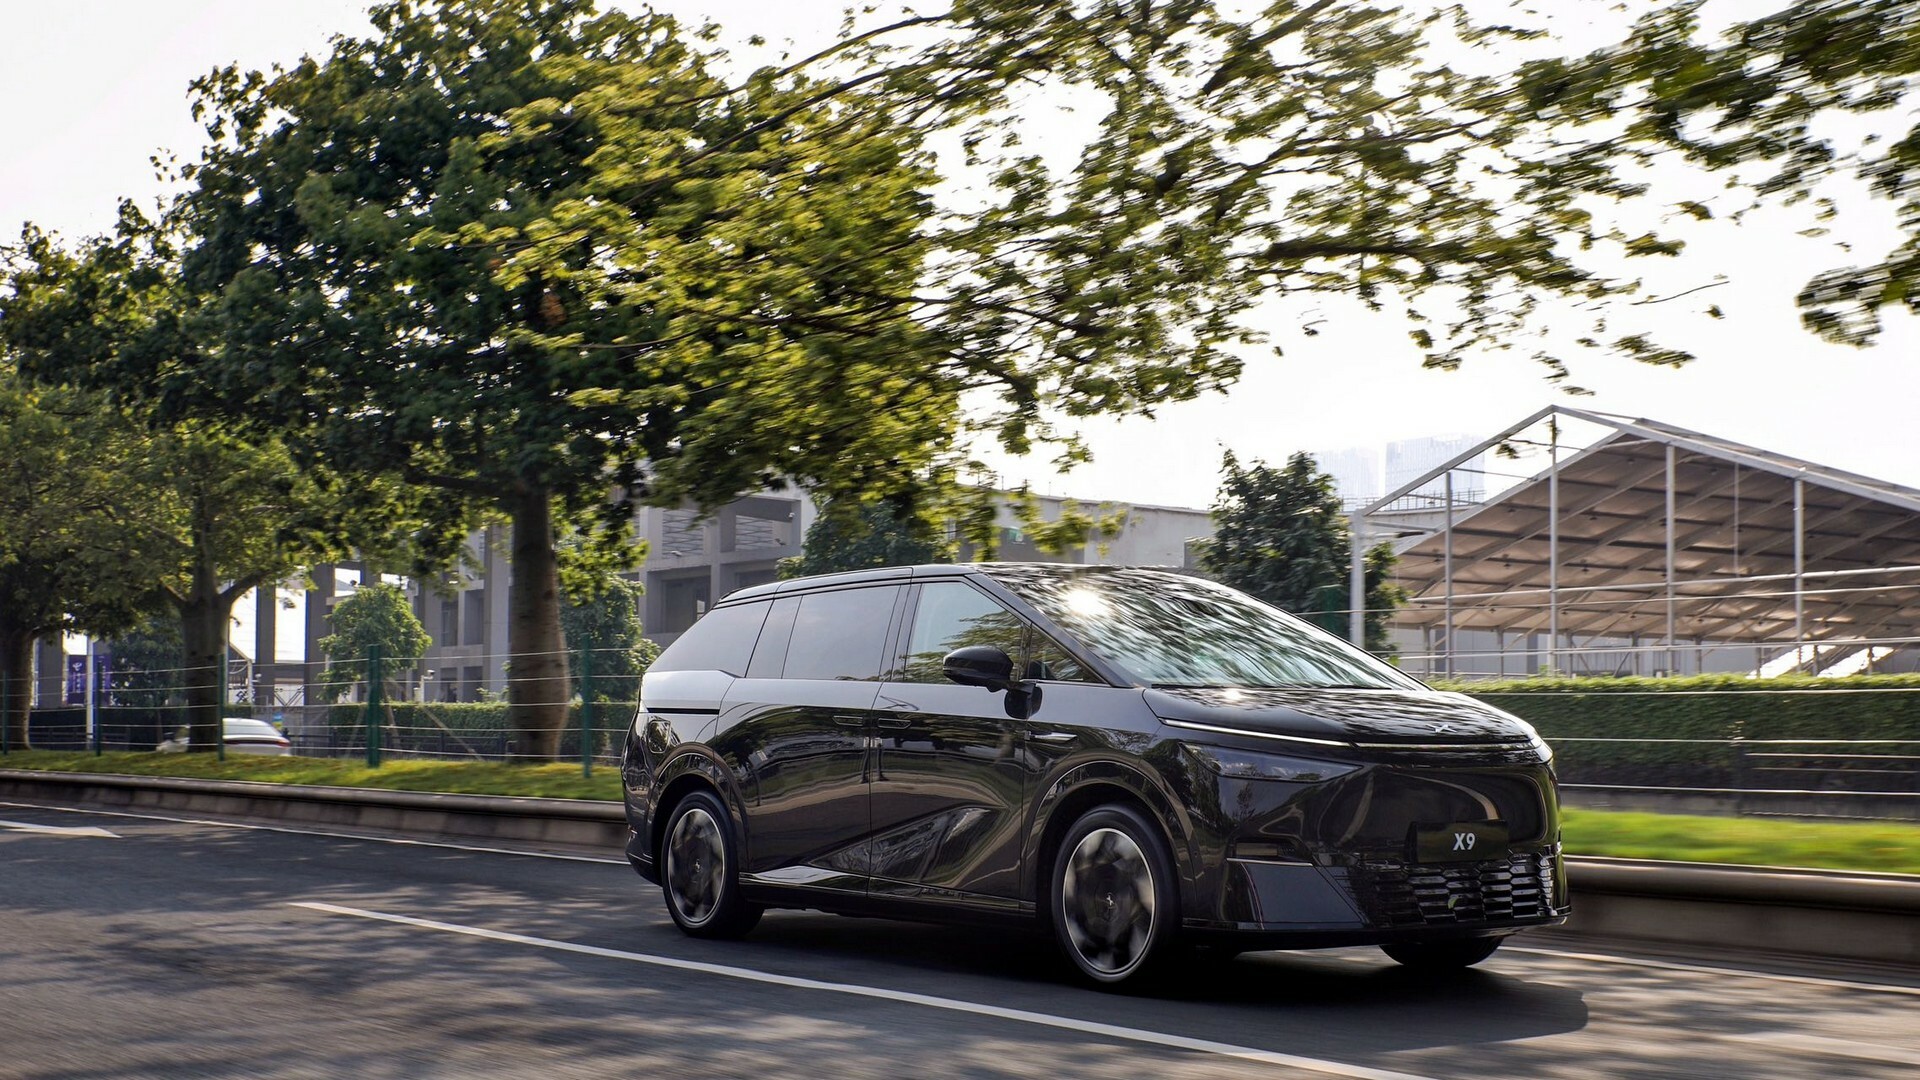
The BMW drove the furthest, but the most impressive result of the year came from the XPeng X9. The Chinese minivan posted a real-world range of 646 km (401 miles), beating its WLTP rating of 580 km (360 miles) by 11.4 percent. That kind of overachievement is nothing new for XPeng, as the G9 SUV topped its advertised range by 13 percent back in the 2023 test.
More: This EV’s Real Range Misses By 23% But That’s Not The Worst Part
At the opposite end sat another Chinese model, the MG IM6 sedan, which managed just 446 km (277 miles), falling 11.7 percent short of its WLTP figure. Nils Sødal, senior communications adviser at NAF, said the result caught the team off guard: “We were surprised to see such a large negative deviation for this MG, especially when the other MG model, the S6, achieved a positive deviation of 3.4 per cent.”
The rest of the field stayed within a tight band, deviating from their stated range by anywhere from -5.7 to +5.4 percent, helped along by the dry roads and mild summer temperatures.
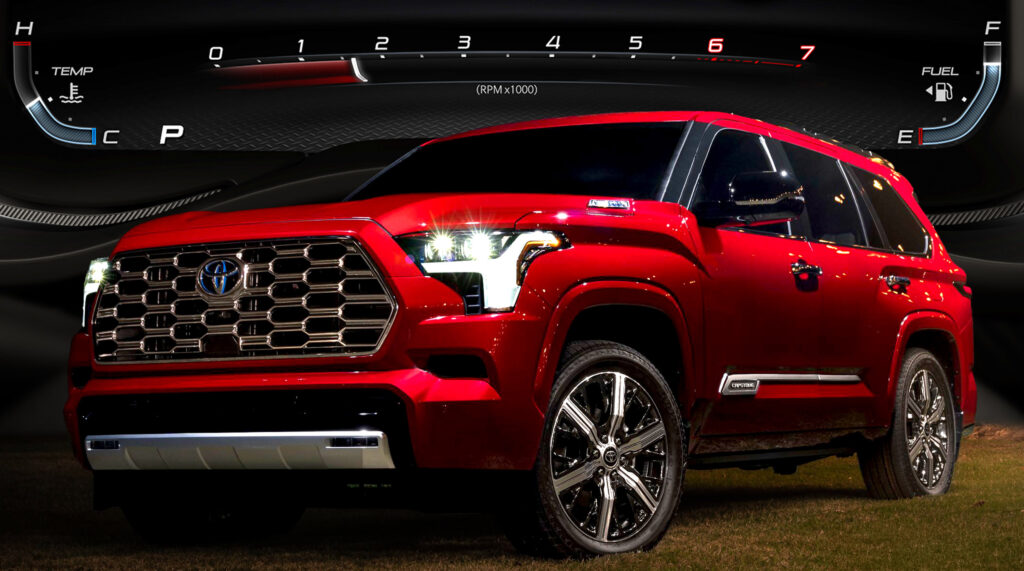
Interestingly, the facelifted Toyota bZ4X perfectly matched its WLTP figure of 506 km (314 miles) on the real-world test. However, the driver stated that the Japanese model showed 0% remaining battery 18 km (11 miles) before it actually ran dry. Keep in mind that NAF pushes these EVs to their absolute limit, driving each one until it’s completely discharged.
Below you can see the results for the full batch of 24 EVs that took part in the summer 2026 edition of the “El Prix,” ranked from the longest to the shortest range on a single charge.
Test Results
| Model | WLTP Stated Range | Real-World Range | Deviation |
| BMW iX3 | 770 km (478 miles) | 781 km (485 miles) | +1.5% |
| Lucid Gravity | 748 km (465 miles) | 720 km (447 miles) | -3.7% |
| Mercedes-Benz CLA | 708 km (440 miles) | 675 km (419 miles) | -4.7% |
| Mercedes-Benz GLC 400 | 643 km (400 miles) | 665 km (413 miles) | +3.4% |
| Xpeng X9 | 580 km (360 miles) | 646 km (401 miles) | +11.4% |
| Polestar 3 | 625 km (388 miles) | 601 km (373 miles) | -3.8% |
| Mercedes-Benz GLB 350 | 563 km (350 miles) | 593 km (368 miles) | +5.3% |
| Toyota C-HR+ | 607 km (377 miles) | 587 km (365 miles) | -3.4% |
| Kia EV4 | 594 km (369 miles) | 575 km (357 miles) | -3.3% |
| Hyundai Ioniq 9 | 600 km (373 miles) | 566 km (352 miles) | -5.7% |
| Smart #5 | 540 km (336 miles) | 556 km (345 miles) | +3% |
| Kia EV5 | 520 km (323 miles) | 509 km (316 miles) | -2.1% |
| Toyota bZ4X | 506 km (314 miles) | 506 km (314 miles) | – |
| MG S6 | 485 km (301 miles) | 502 km (312 miles) | +3.4% |
| Citroen E-C5 Aircross | 513 km (319 miles) | 500 km (311 miles) | -2.5% |
| Mazda 6e | 479 km (298 miles) | 485 km (301 miles) | +1.2% |
| BYD Atto EVO | 470 km (292 miles) | 460 km (286 miles) | -2.1% |
| MG IM6 | 505 km (314 miles) | 446 km (277 miles) | -11.7% |
| Changan Deepal S05 | 445 km (277 miles) | 431 km (268 miles) | -3.1% |
| Kia PV5 | 412 km (256 miles) | 420 km (261 miles) | +1.8% |
| Hyundai Inster | 360 km (224 miles) | 373 km (232 miles) | +3.5% |
| KGM Musso | 379 km (235 miles) | 369 km (229 miles) | -2.6% |
| Dongfeng Vigo | 340 km (211 miles) | 348 km (216 miles) | +2.3% |
| Kia EV2 | 308 km (191 miles) | 325 km (202 miles) | +5.4% |